


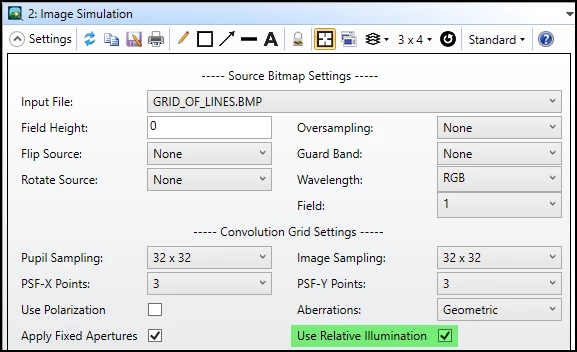
In this post, we will demo an example to show how relative illumination is used in the tool Image Simulation. One of the frequently asked questions about Image Simulation is how it affect the result when we check the option 'Use Relative Illumination'.
Another related question is whether this tool has considered gamma correction, such like the transfer function defined in the sRGB color space.
Quick answers to the two questions are:
(1) If the relative illumination is considered, for every PSF calculated in the PSF grid, the relative illuminateion is calculated for that field position and the entire PSF for that field position is multiplied by that value.
(2) There is no gamma correction done in the Image Simulation result. The gray scale value you find in the result bitmap is linear to the relative illumination we see.
Let's do a quick experiement to see how it works.
1. Open attached test2_50deg.zar. This is a very simple system inlcuding only OBJECT, Paraxial lens, and IMAGE.
2. First open Spot Diagram to check some values. For the beam from 40 degrees, it lands on the image position of 83.91.
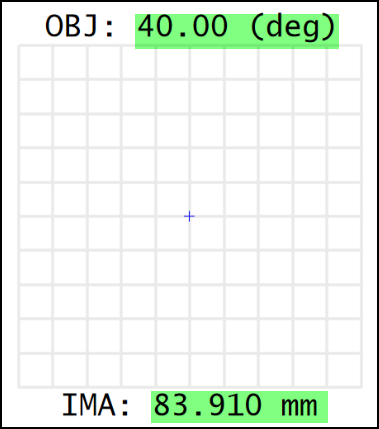
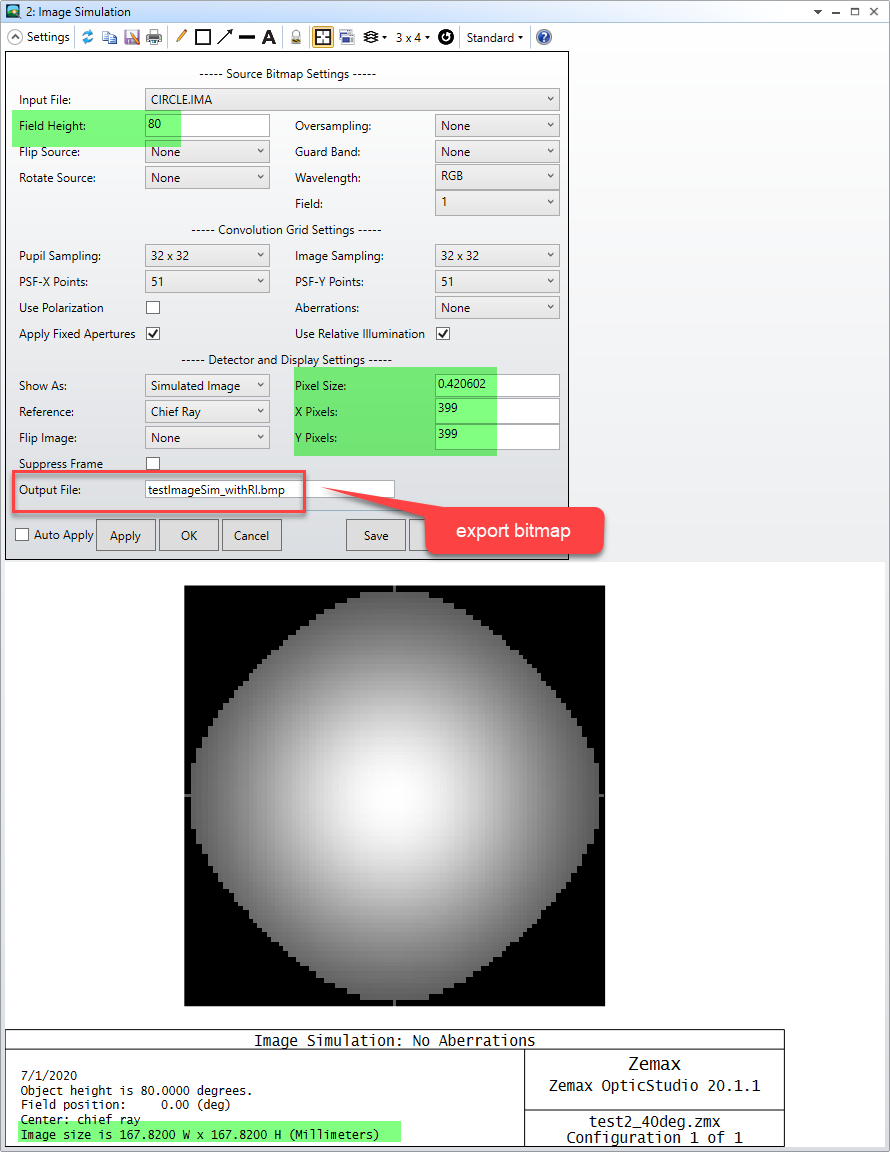
3. This then is used to set the Fiedl Height = 40 * 2 = 80 and Image Size = Pixel Size * (X/Y Pixels) = 0.420602 * 399 = 167.82. Note we have set up to export bitmap for the result.
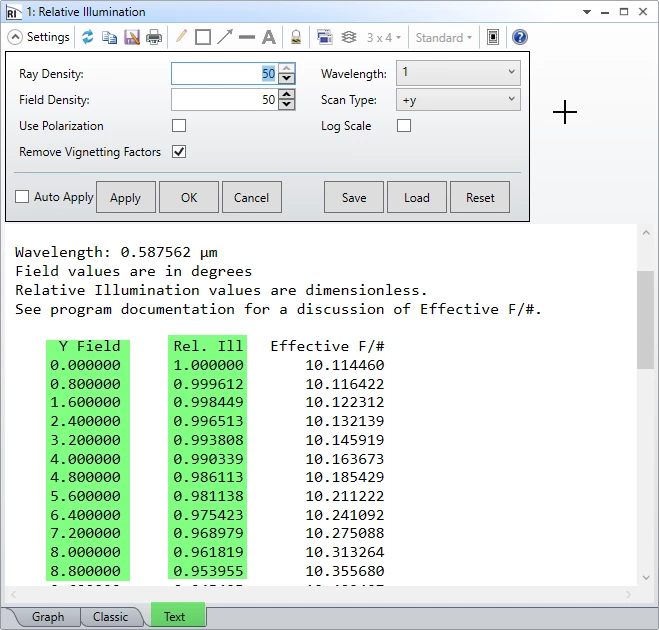
4. Now let's open Relative Illumination and copy its RI value in excel.
5. On the other hand, we can also measure the gray scale data from the exported bitmap using tools like ImageJ or MATLAB.
To compare the data with RI, we need to be some modification to the data. All the folloiwng calculation are done in excel file pasted in the first reply in this thread.
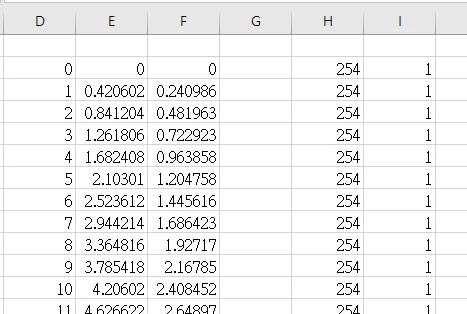
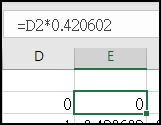
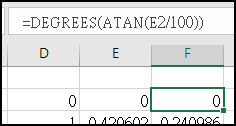
If we measure from center to edge, there should be 200 gray scale data. It's numbered by 0~200 as column D in below. Then we multiply column D by pixel size 0.420602 to convert it to position on image plane, as shown in column E. Then we can use tangent relation shift to further convert it to Field Angle, as shown in column.
For the gray scale, we simply need to normalize it by the maximum value, which is resulted in column I.
6. Then if we compare the result from Relative Illumination and Image Simulation, we can see they match well as below.
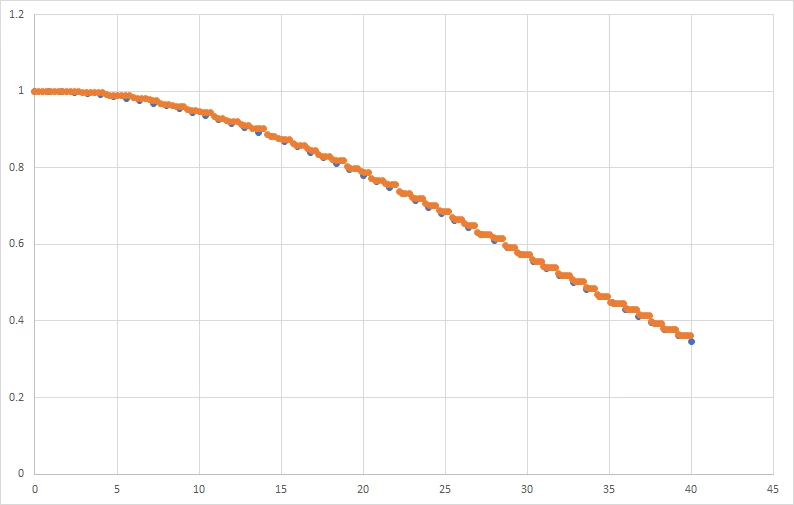
In concludsion, in this example, we can clearly see how Relative Illumination's data exactly linearly match to the gray scale in Image Simulation.