Solved

How do I output the image of an analysis in ZOS-API?

  • 20 February 2020
  • 8 replies
  • 1117 views

Userlevel 6
Badge +2
I am using Huygen's PSF in ZOS-API, and I want to be able to render the same False Color plot I see in OpticStudio. See below:


How do I do that?
icon

Best answer by Allie 20 February 2020, 01:50

View original

8 replies

Userlevel 6
Badge +2

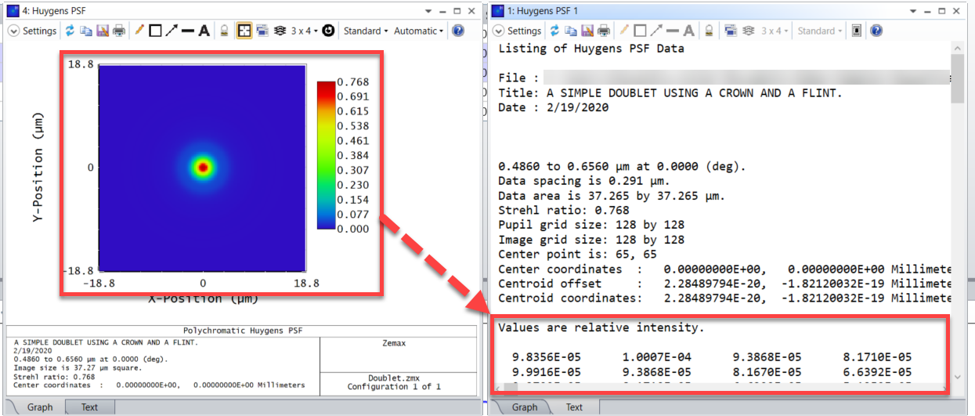
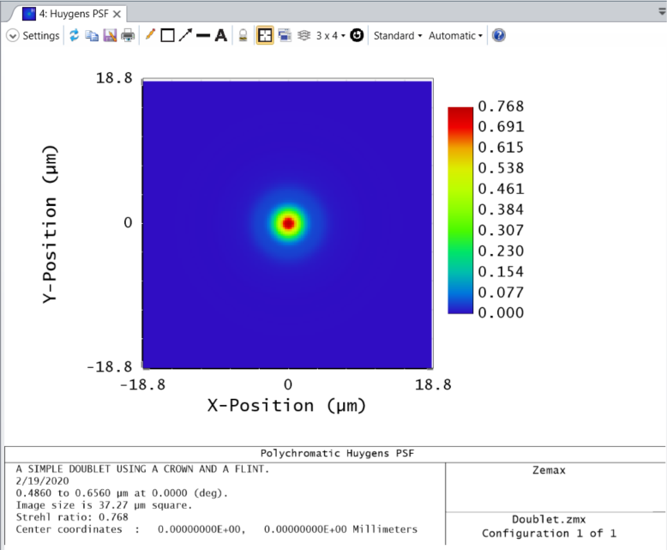
These types of plots (Huygen's PSF, Wavefront Map, Detector Viewer, etc.) are generated with a matrix of data points provided within the "Text" tab of the same analysis window. This matrix data may be pulled into the API using the ZOSAPI.Analysis.Data.IAR_ Interface and made into a figure.

Analysis window data is split into multiple categories within the IAR_ Interface. A matrix of data (shown above) will typically be provided as a DataGrid while a 2 column list of data (such as that given by a Cross Section plot) will be provided by a DataSeries. Sometimes, analysis window results are not pulled into the API, in which case we must pull the results into an external text file. See "Generating a list of output data types for each analysis in the ZOS-API" for more information.

As long as the data is accessible, we can pull it into the API using the corresponding IAR_ Interface property. Below is a Matlab example of this process:

TheSystem = TheApplication.PrimarySystem;

% Open the Huygen's PSF. We will use the default settings for now   
huygensPSF = TheSystem.Analyses.New_HuygensPsf();       

% Run the analysis with the current settings and pull the results 
huygensPSF.ApplyAndWaitForCompletion();   
huygensResults = huygensPSF.GetResults();       

% The results will be split into multiple data structures   
% One structure will house the header information   
% Another structure will house the relative intensity values   
% Pull the structure with the intensity values   
matrixData = huygensResults.DataGrids(1).Values.double;       

% OpticStudio has pixel (1,1) in the top left of the matrix   
% Matlab places the (1,1) at the bottom so we need to flip the matrix   
huygensData = flipud(matrixData);       

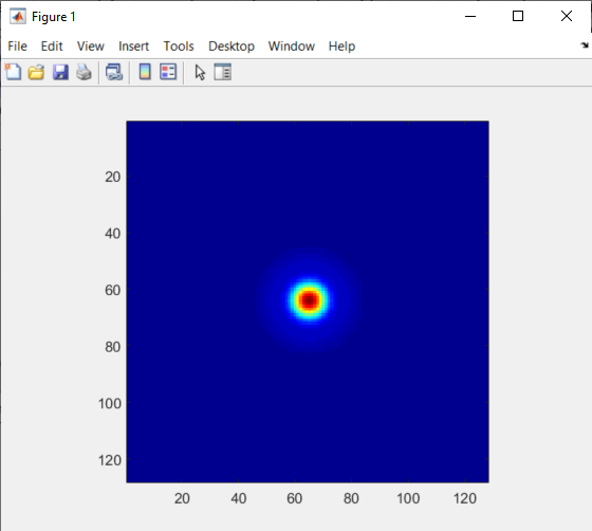
% Use pixel data to create a figure   
% The jet colormap will match closely with the False Color plot   
imagesc(huygensData)   
colormap jet;   
axis square;       

% Close the Huygen's plot   
huygensPSF.Close();


Userlevel 6
Badge +2

The code above will take the matrix data as supplied here:


And generate the following plot:

Hi Allie Culler,

I have a same problem about the image export from the analysis in ZOSAPI. 

In the macro, OPENANALYSISWINDOW and EXPORTJPG can do that. 

However, these two macros require to open a real instance Zemax file in screen. 

How do I do for saving an image of analysis (e.g., FFT MTF) without open a real instance Zemax file in screen?


PS: I'd not like to pull the data from ZOSAPI and then plot it by other program like Matlab or C# 

because it is very inconvenient. 

Userlevel 5
Badge +2

Hello Cheng-Mu,


You are right, ZPL macros are run inside the OpticStudio graphical user interface (GUI), so they require Zemax to be open. However, this is not the case for the ZOS-API. ZOS-API allows applications to either communicate directly with opened instances of OpticStudio or to run OpticStudio as a background process. You may find more information about the differences between ZOS-API and ZPL, and the different communication modes of ZOS-API in the following knowledge base articles:


The differences between ZOS-API, ZPL and DLL


Sample code for ZOS-API users


Unfortunately there is currently no API function to export graphics like  EXPORTJPG does in the ZPL. However, this is currently a feature request in to have this capability added to the API and I will add your name to the list of users who have requested it. I will make sure to follow-up if this feature is added to a future version of OpticStudio.


In the meantime, you can pull the data and create a plot inside of Matlab, as discussed above.

Dear Csilla Timar-Fulep, 

Thanks for your replying. 

I ever tryied to use a macro in MFE to run the OPENANALYSISWINDOW and EXPORTJPG. 

After executing the ZOSAPI like MFE.CalculateMeritFunction(), 

we can find a figure with format .jpg but there is no any information in this figure. 

I think the problem is that the OPENANALYSISWINDOW cannot really open the analysis graphic when running ZOSAPI. 

Badge +1

Hello Cheng-Mu,


Using the ZPLM operand in a macro should work, but only if running in Interactive Mode. The reason why using a ZPLM operand works in Interactive Mode is all the necessary libraries for rendering the graphics are already loaded with the GUI version of OpticStudio, so when you call the EXPORTBMP via the ZPLM, the macro can render the analysis and then save the results to disk. When you run the API script as a Standalone Application, the necessary libraries and drivers to render the actual plot are suppressed so when you call the ZPLM operand, the macro cannot render the analysis and thus you get the 0kb file.


Best,


Ali

Userlevel 6
Badge +2

Hi all! 

I’m adding a sample from Python to this post. It performs the same actions as the one up top in PythonNET. This was completed using the Standalone Application mode. See below:

    import matplotlib.pyplot as plt
import numpy as np

# Open file
sampleDir = zos.TheApplication.SamplesDir
testFile = sampleDir + "\\Sequential\\Objectives\\Cooke 40 degree field.zos"
TheSystem.LoadFile(testFile, False)

# Open the Huygen's PSF. We will use the default settings for now
huygensPSF = TheSystem.Analyses.New_HuygensPsf()

# Run the analysis with the current settings and pull the results
huygensPSF.ApplyAndWaitForCompletion()
huygensResults = huygensPSF.GetResults()

# The results will be split into multple data structures: Header, Intensity data, Metadata
# We want the intensity data. This is the same data you will see in the Text tab of the analysis
matrixData = huygensResults.GetDataGrid(0).Values
xLength = matrixData.GetLength(0)
yLength = matrixData.GetLength(1)

# Reformat the data so that it matches the output we see in OS
# We must also convert the matrix into a Python array for post-processing
huygensData = zos.reshape(matrixData, xLength, yLength, False)

# Plot the data
plt.figure()
plt.imshow(np.flipud(huygensData), cmap='jet', extent=[-xLength, xLength, -yLength, yLength])
plt.colorbar()
plt.show()

The resulting image is shown here:


Hello,

I am using python and want to edit the surfaces in NSC mode and each time save shaded mode image as png or jpg.

Example 17 - Python is showing how to set parameters on shaded model but not how to save it as an image.
I tried “analysis.ToFile()” but all I get is an empty image of KB.
 
How can I access to the “save” button:


Reply