Hello,
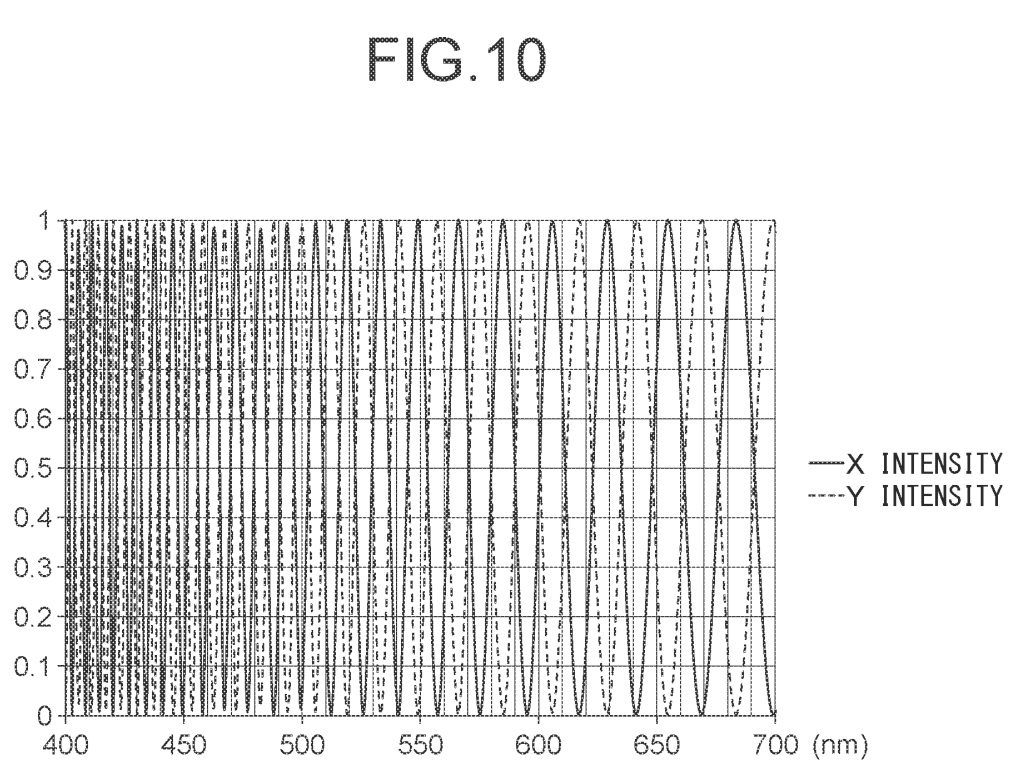
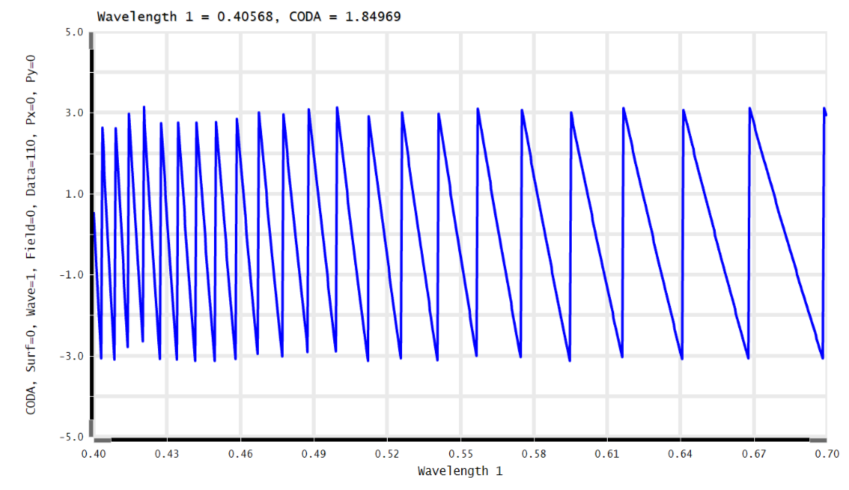
I’m trying to simulate a higher order birefringent quarter-wave plate as described in US patent 11857158. I’ve implemented example 2 in the attached file (REPLACE .txt WITH .zprj) . I see a phase difference (CODA data =110) that approximately matches the plot.


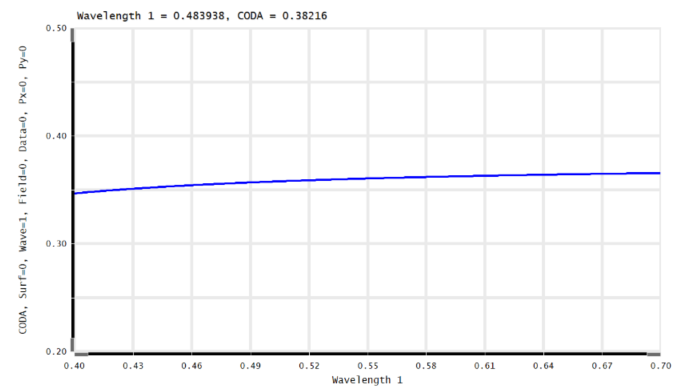
My goal is to reproduce the X and Y intensity plots. My naive thought was to put a ‘X analyzer’ Jones Matrix on the output to create the solid line, but not having any luck... When I look at the ‘The relative transmitted polarized intensity’ vs wavelength I don’t see the high frequency intensity changes…

Any help would be appreciated.
Kind Regards,
John


