Hello there Zemax community,
I am trying to generate a ray dataset from a data array which represents the Poynting flux at the far-field from a nano-structure which generates a somehow Gaussian-like far-field profile.
This is the process that I used for generating my far-field intensity:
- I extract all far-field components (E and H) at a given r distance from my source plane.
- Using these far-field components I calculate the Poynting vector components.
- In this case, I have extracted the data over the surface of a half sphere which covers my full upper hemisphere.
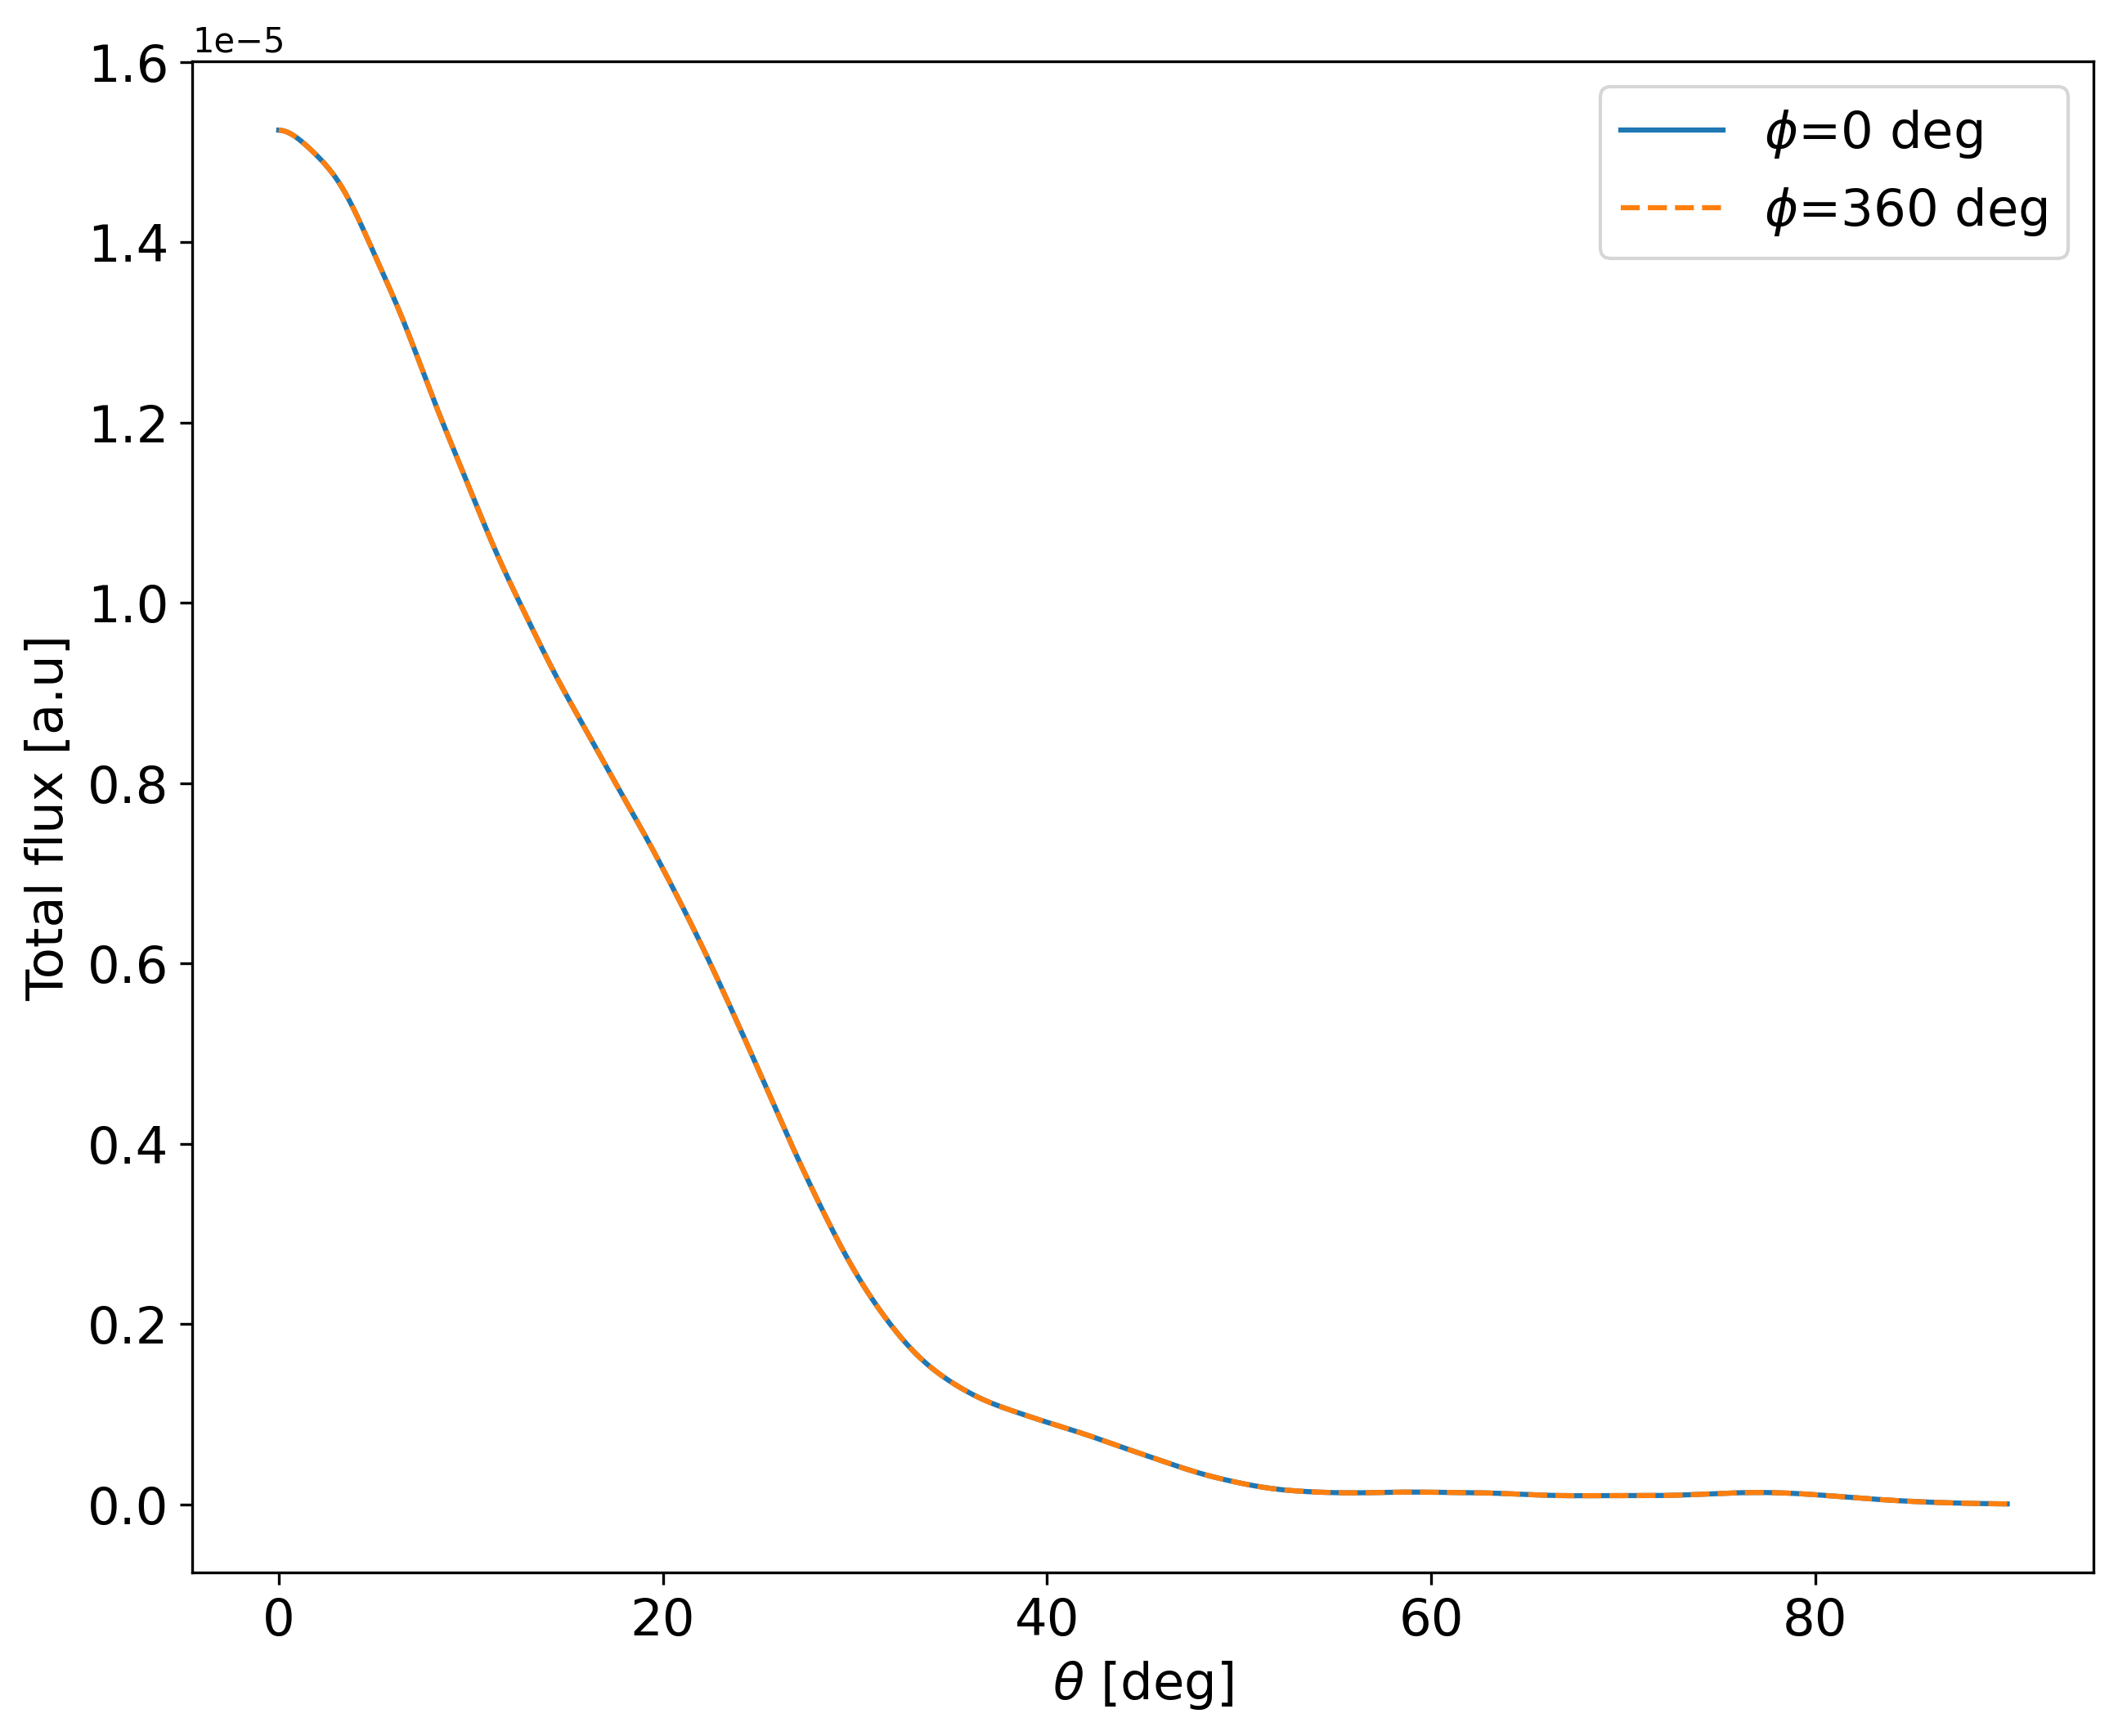
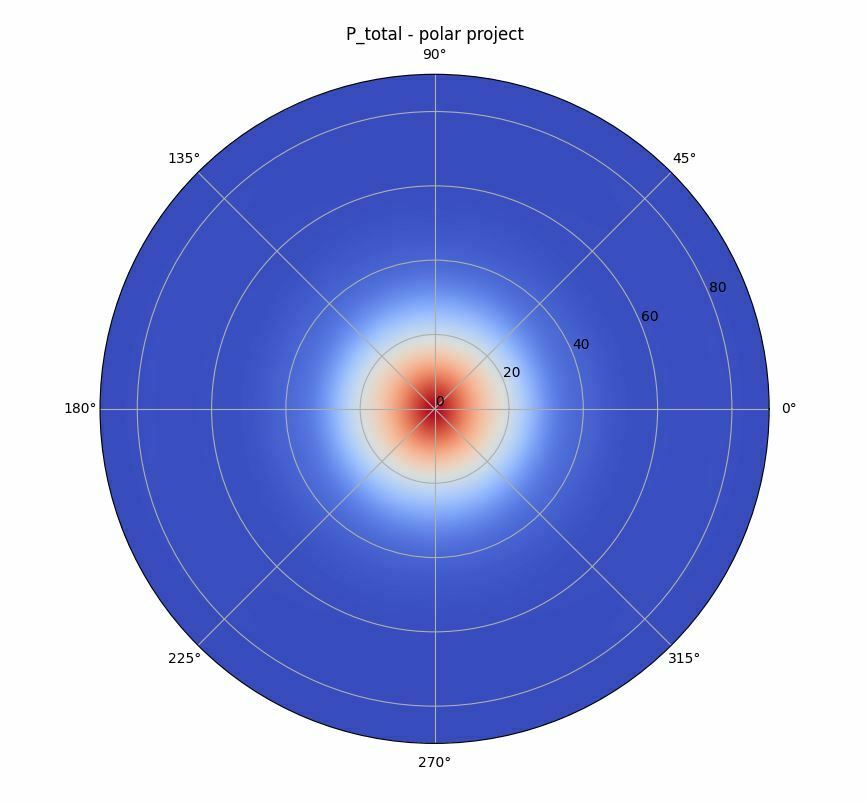
This data is extracted from an open source FDTD solver and I know how does the intensity distribution should look like. Below plot shows the computed Poynting flux over the sphere surface projected over a 2D plane. (the radial axis is equivalent to the polar axis and the azimuthal axis represents what it is supposed to)
I have followed Zmx help documentation in order to generate a .DAT file from above intensity information. I generate a file in where each line contains:
0 0 0 m l n flux_from_above
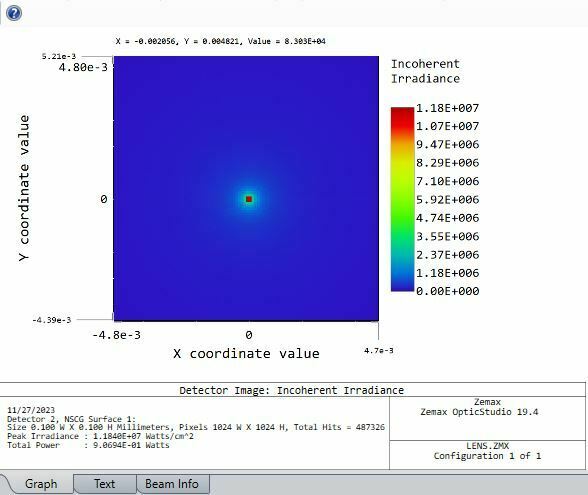
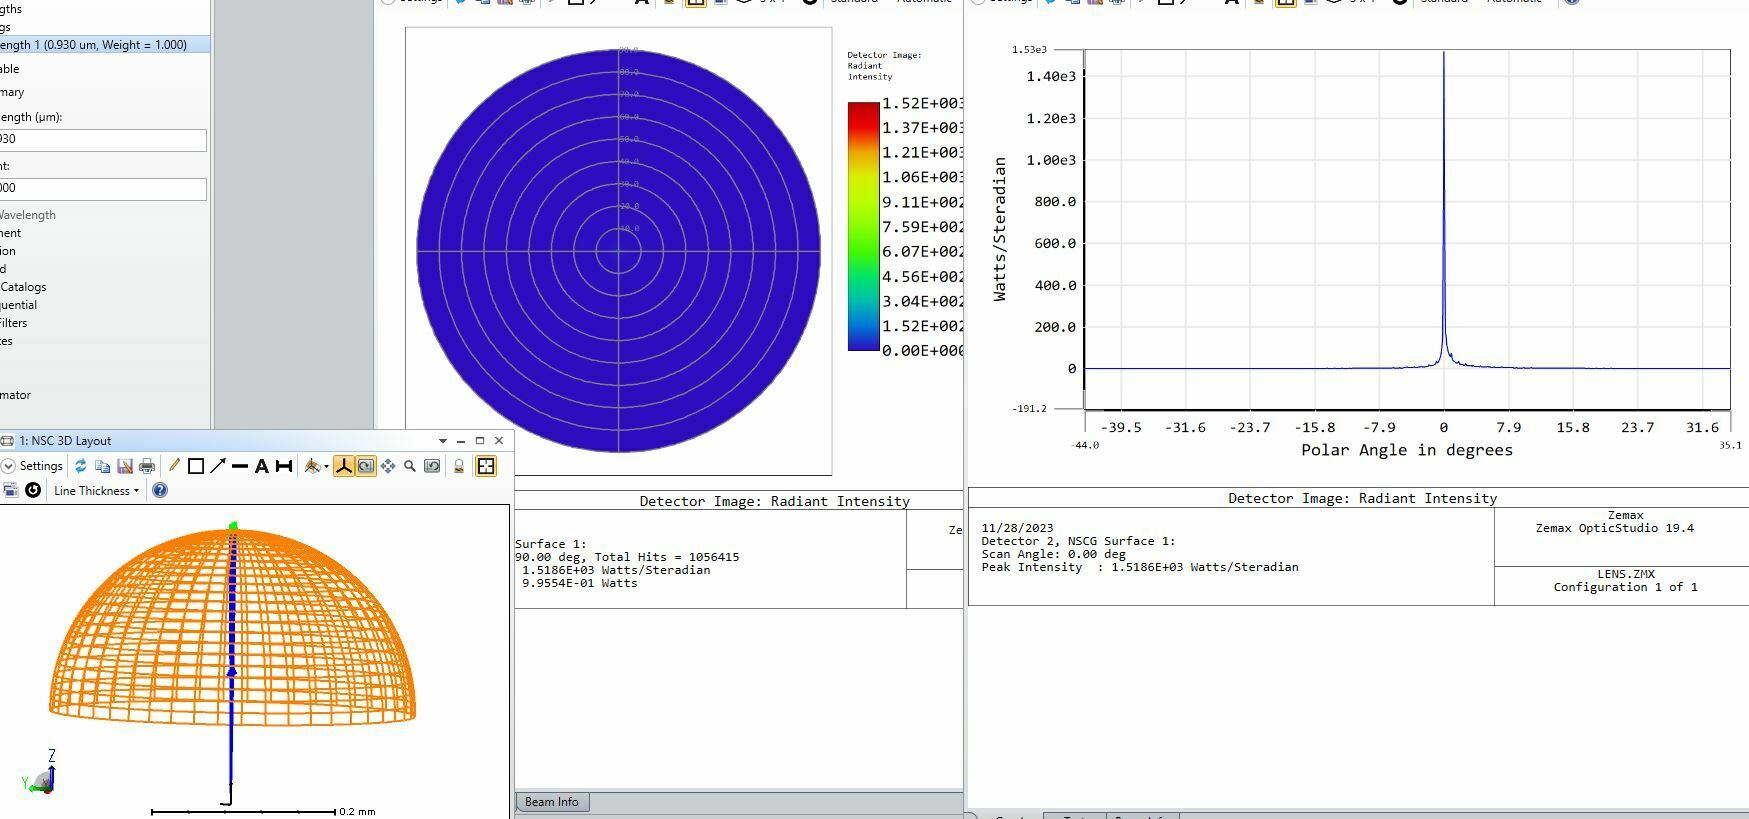
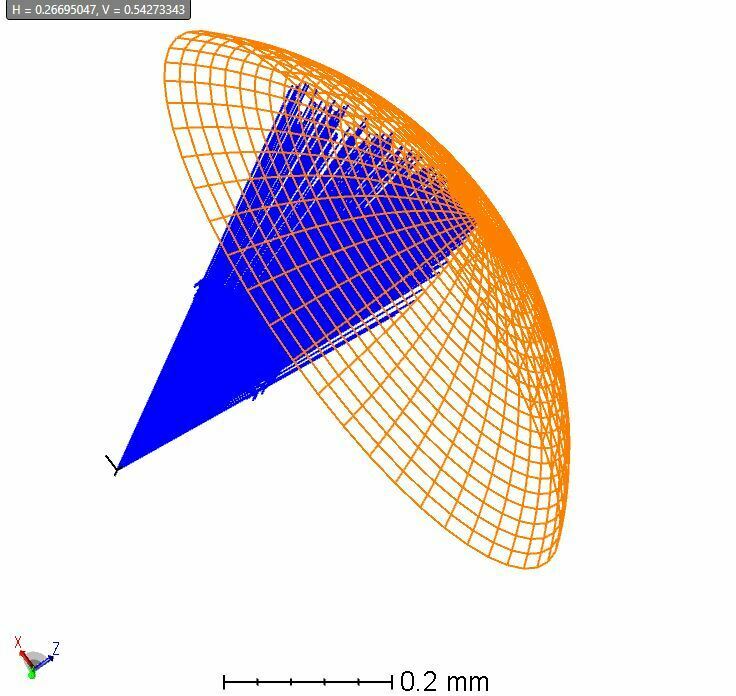
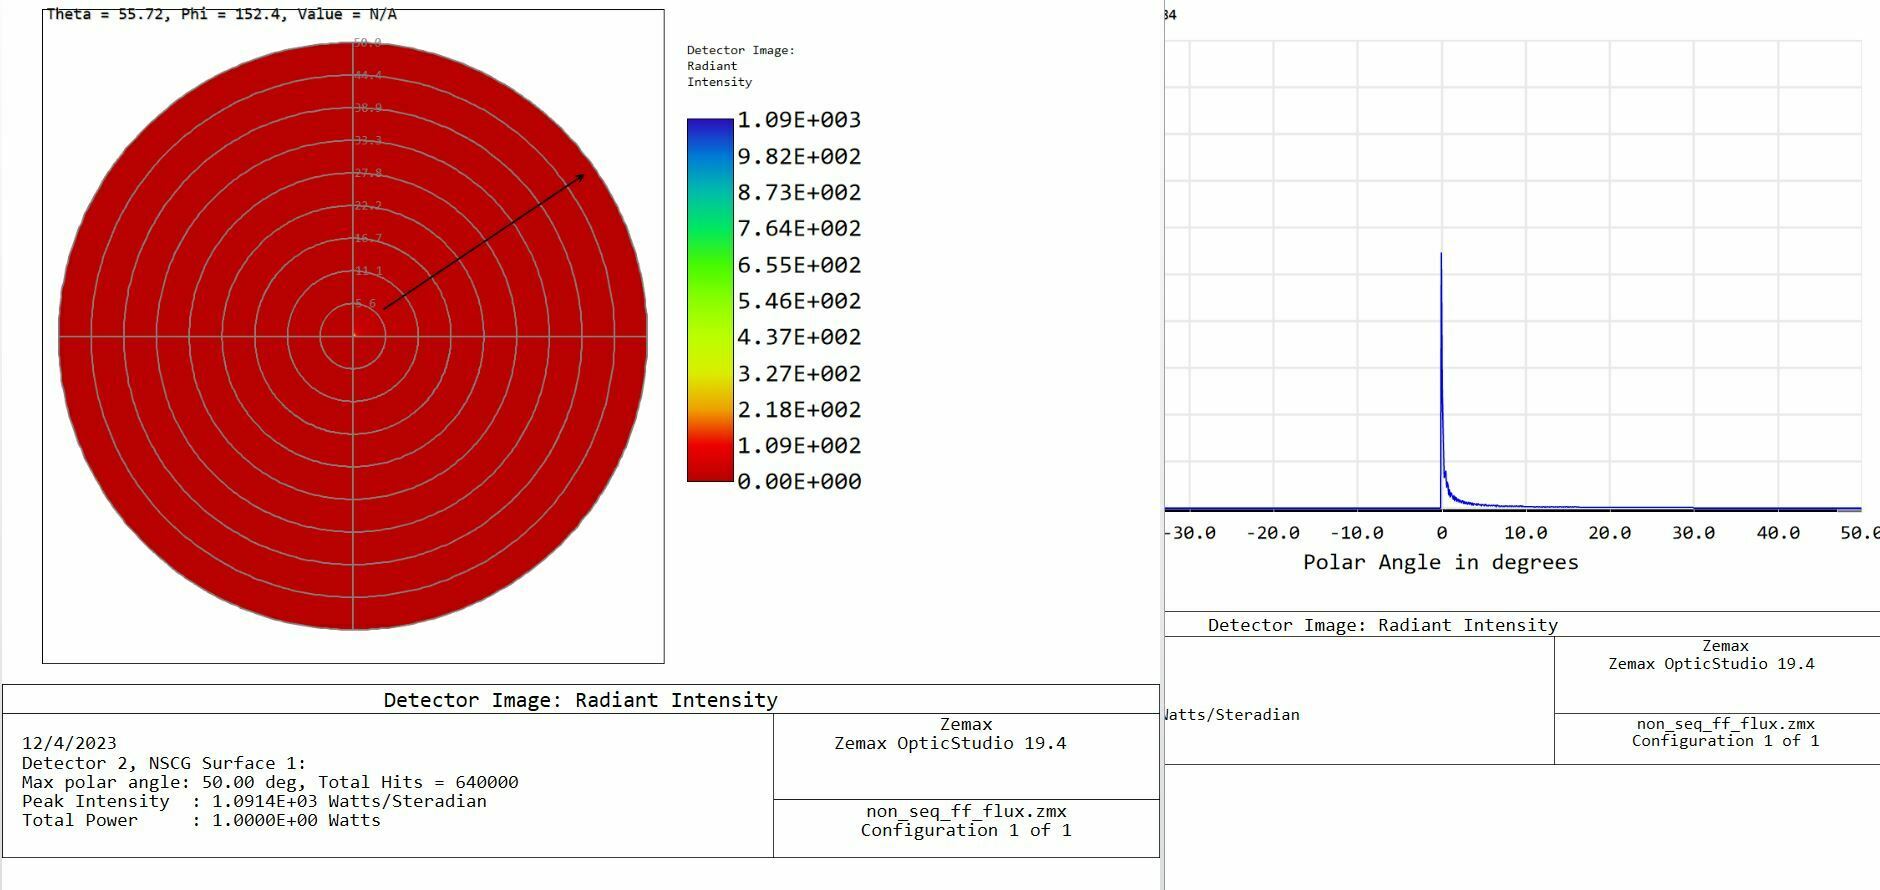
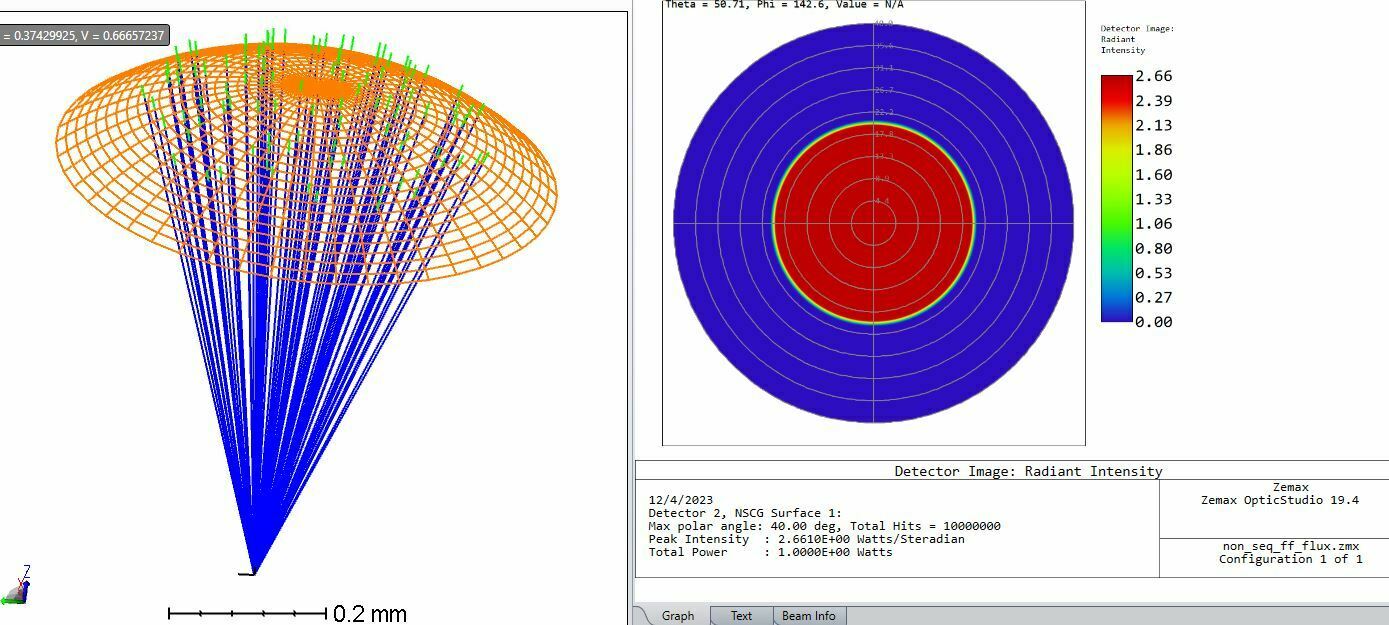
However, once I try to use and import this DAT file into Zmx via a source file, the obtained ray distribution is not what I would expect. Also, by taking a look to the irradiance collected by a detector, I just obtain an uniform irradiance profile:
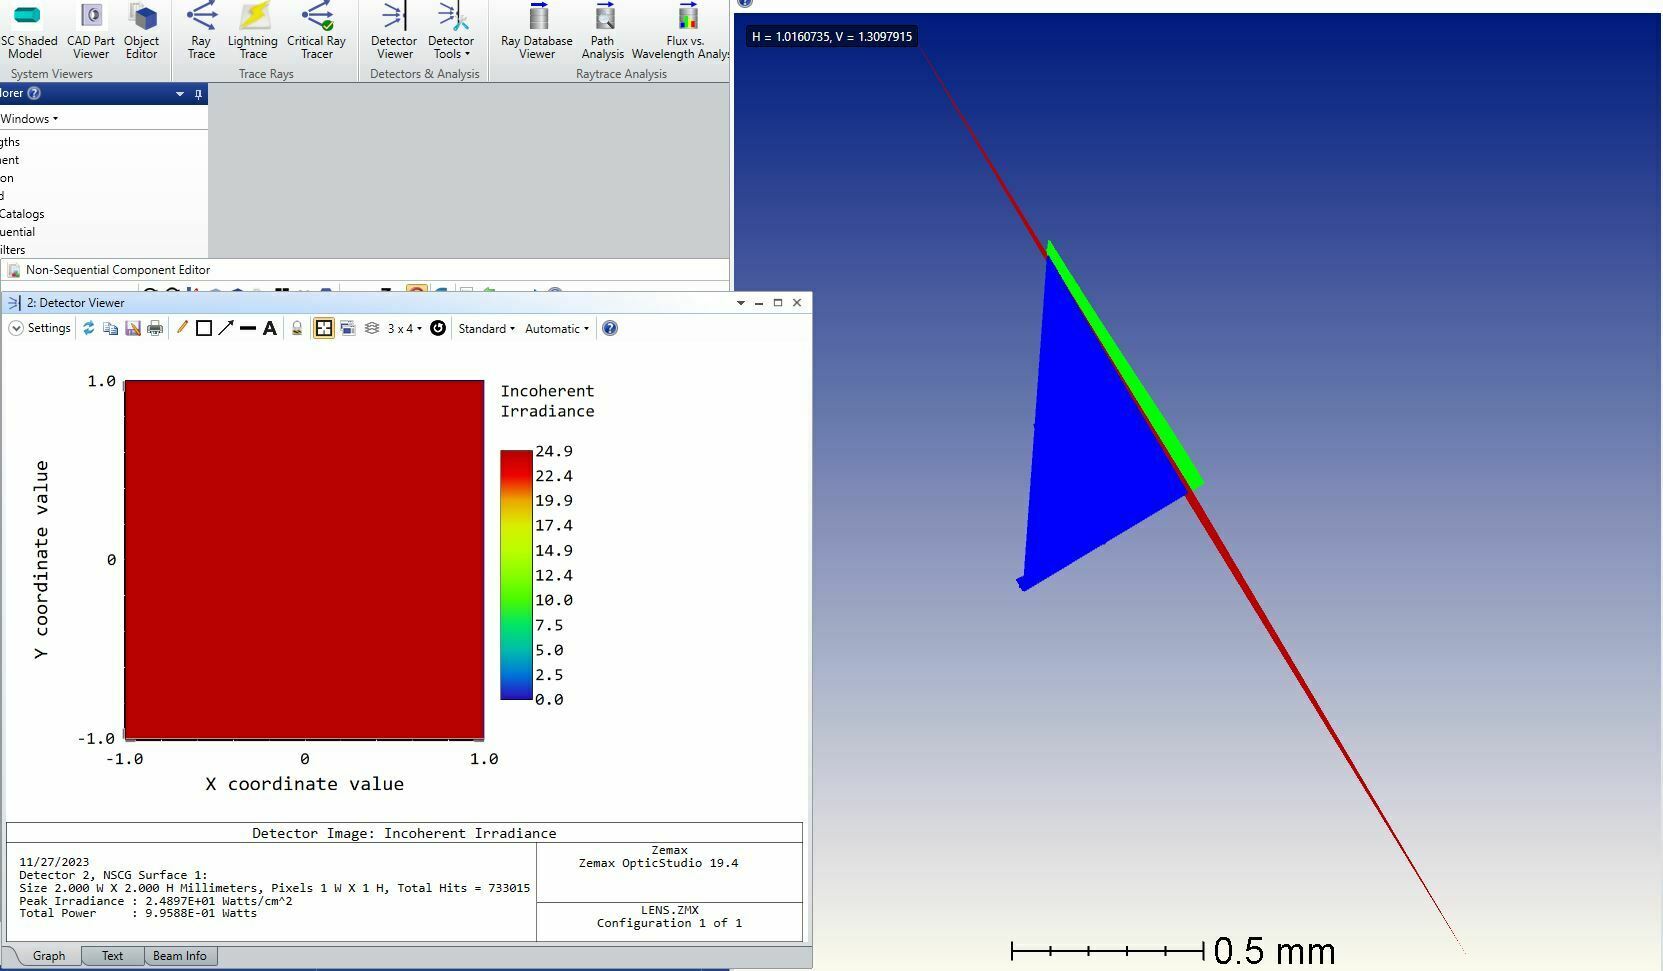
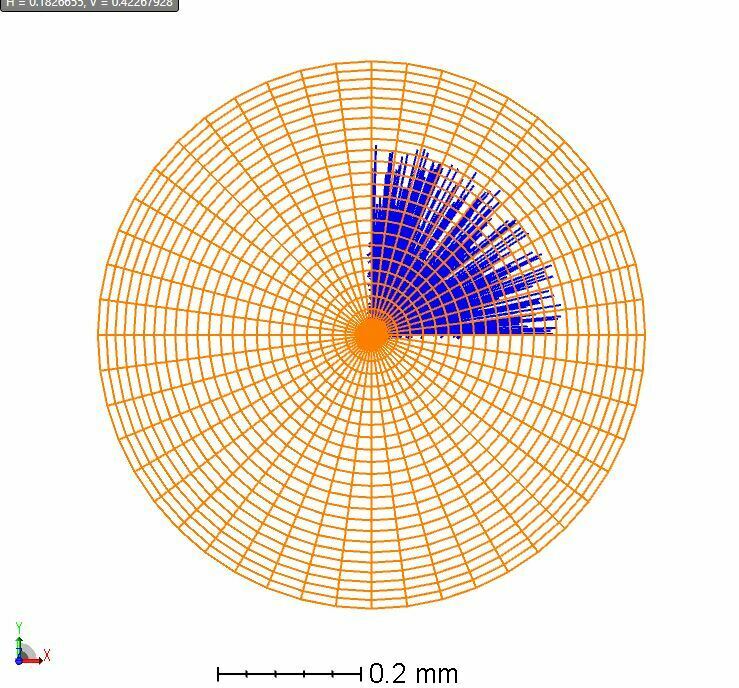
Additionally, as you might observe, the generated ray distribution does not have the circular distribution shape that I would expect based on the polar plot that I have included above. In fact, the rays are just extending over a line.
Any idea about what could be happening here? Any comment and feedback will be highly appreciated.