Question

Flux v.s. Wavelength Graph Not Gathering Data

  • 26 April 2023
  • 1 reply
  • 57 views

Badge

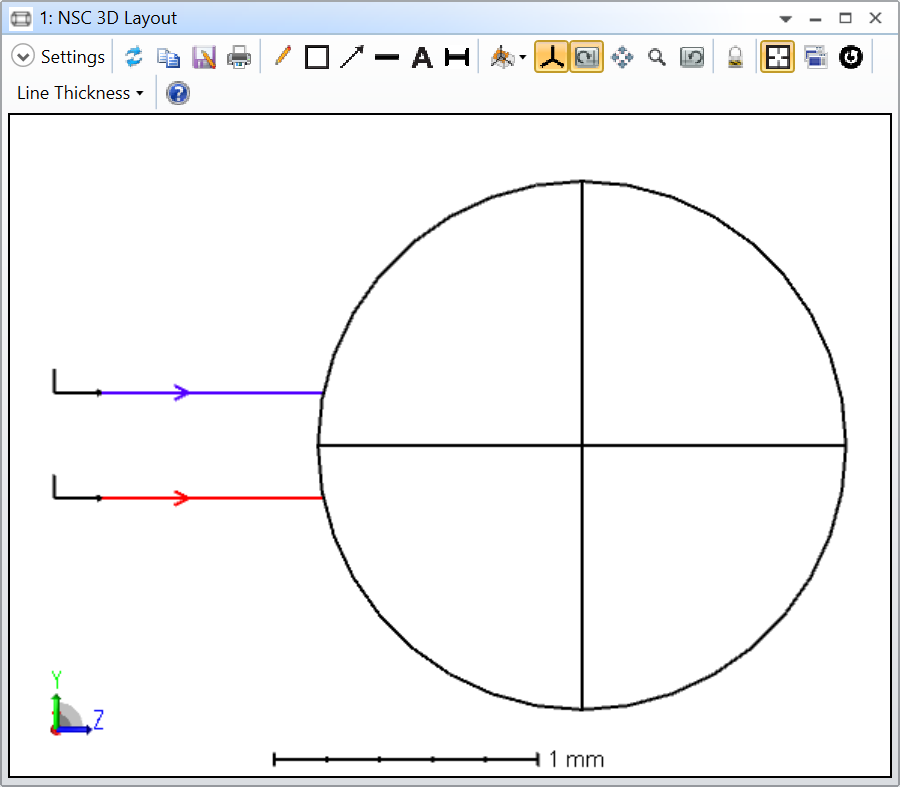
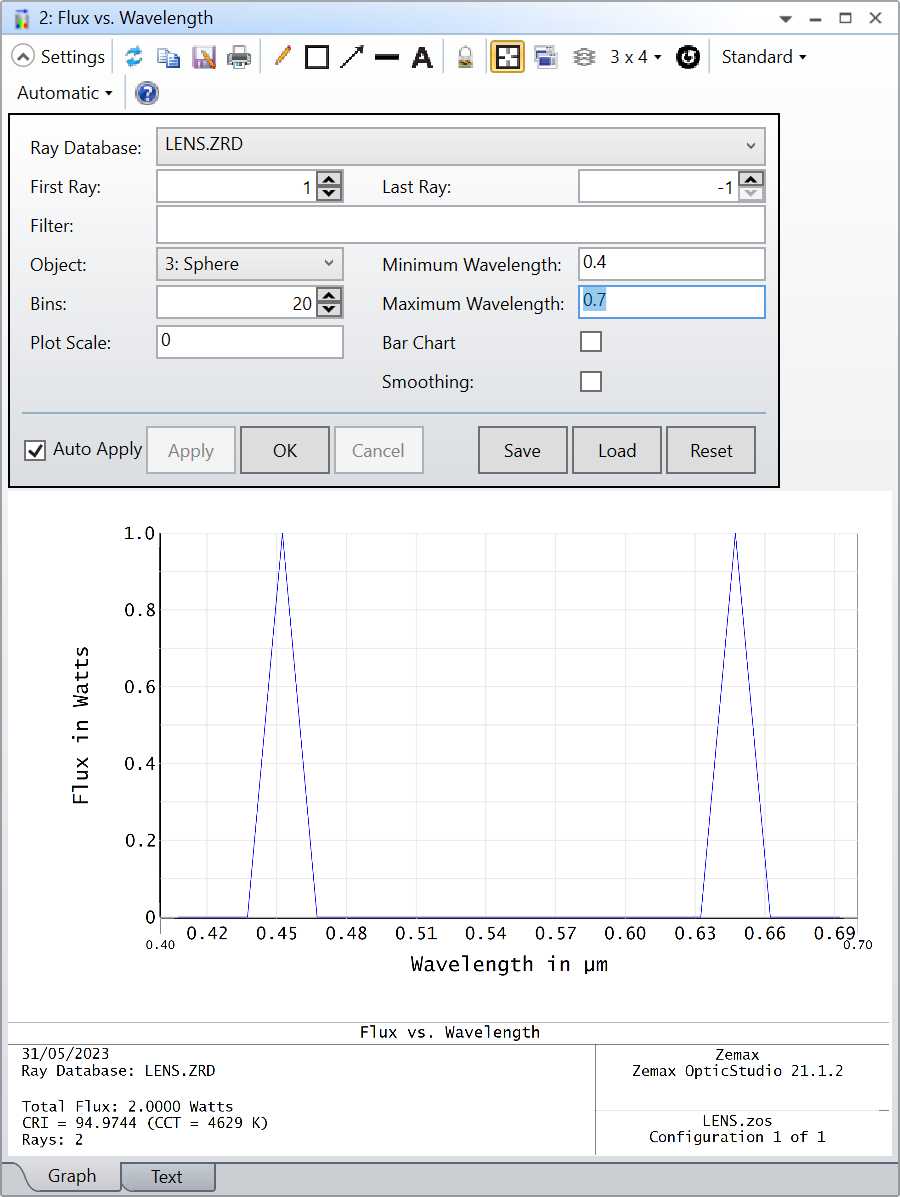
I am trying to use the Flux v.s. Wavelength tool on Zemax to gather information for calculating a resolution of a lens involving a grism. 

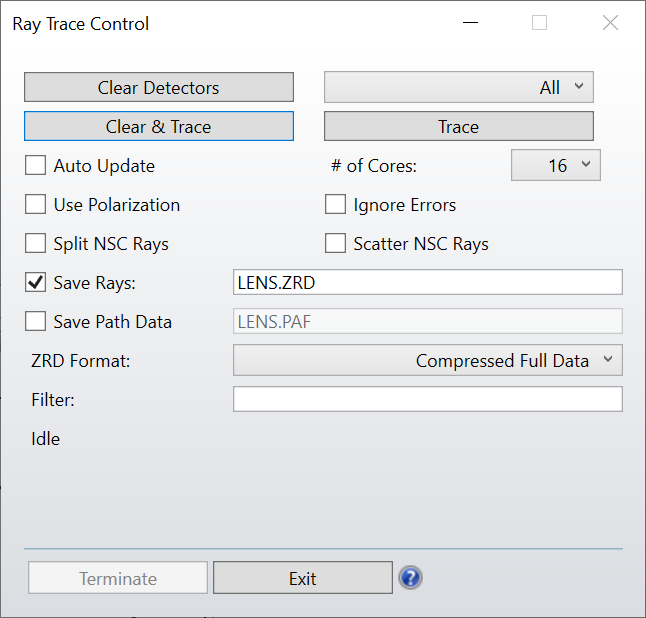
When I run the program, the graph shows a straight line with a measurement of zero flux. I believe my program is having problem collecting the rays properly, however I have tested different ray databases and experimented with other options as well. Any ideas?

(Will also take secondary advice on a possibly better way to gather data on resolutions)


Thank you,


New Zemax User


1 reply

Userlevel 7
Badge +2

Hi,


I don’t understand the quesiton, but perhaps I can demonstrate how to use the Flux vs. Wavelength analysis.

I’ve created a dummy file (that I will attach to my reply for your reference), with two Source Ray (one at 450 nm, and another at 650 nm) that intersect a Sphere object (the Material of the Sphere is ABSORB such that each ray only crosses the sphere once, otherwise you might detect more energy than you are actually sending onto the sphere):

Each Source Ray has a single layout and analysis ray and each ray is given 1 W of optical power. I then run a Analyze..Ray Trace and I Save Rays. This is important because it creates a ray database with the *.ZRD extension that the analysis requires:

Finally, I run the analysis, and open the settings and change Object: 3: Sphere, and I also change the Min/Max Wavelength to 0.4 and 0.7 respectively:

As you can see, we have 1 W at 0.45 and 1 W at 0.65. The accuracy depends on the number of Bins that you choose in the settings as well.

Does that make sense? Is that what you were doing before? Do you have a file to share with us for troubleshooting?

Take care,


David


Reply