I am creating .dat file in MATLAB for vertical coma, but after importing in Zemax as a grid phase, I can see in surface sag that it is horizontal coma, rotated 90 degree clockwise.  How to resolve this issue?
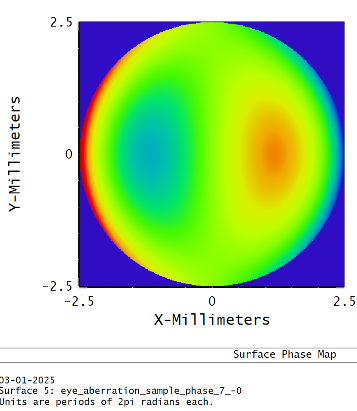
 

I was going to suggest you could import the data onto a composite surface, then rotate about Z. However, I see grid phase is not a supported surface type with the composite surface.

It could be how your data is defined in MATLAB. Maybe you are flipping X and Y coordinates during your conversion to grid phase data?


Thanks for the suggestion. I couldn’t find a flipping of the coordinates. Can you pl look into the code ?


Not a matlab user, but the transpose function should do the trick. Be carefull if your x and y scaling is not identical, but for this example this should be no problem.


Looking at your code, I’d change the following line:

simulated_wavefront_radians_flattened=simulated_wavefront_radians(:); 

to

simulated_wavefront_radians_flattened=transpose(simulated_wavefront_radians(:))


Reply