Solved

Extracting data from Lens Data using ZPL and creating graphs


Hello, 
 

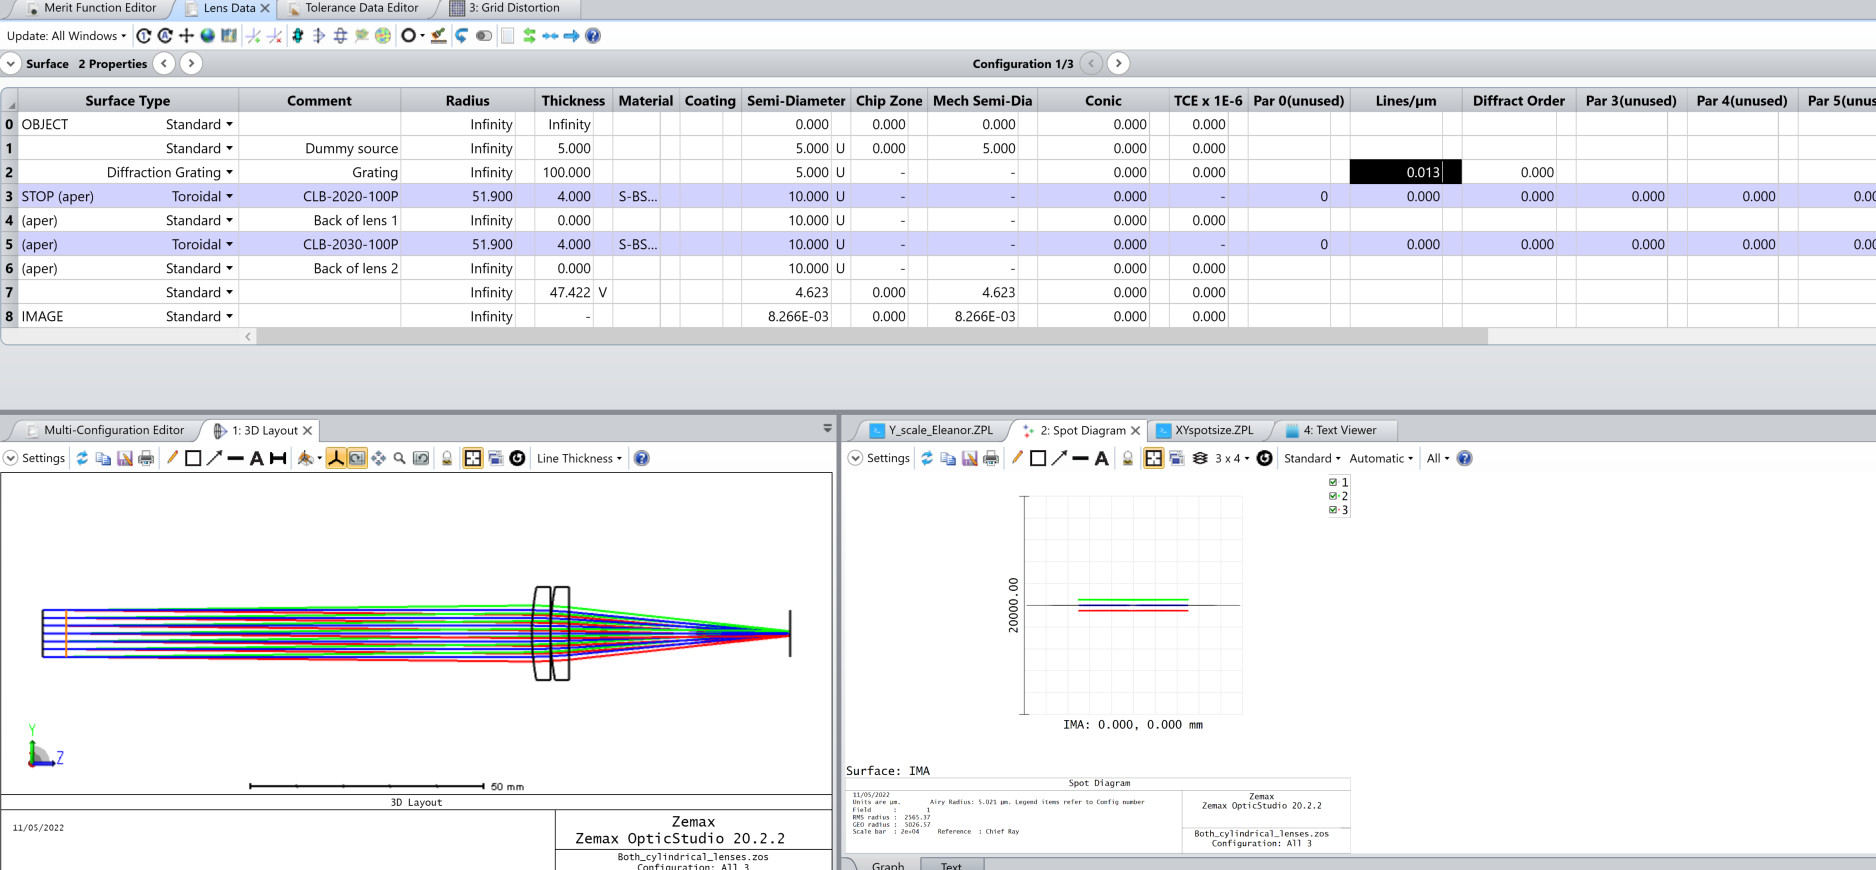
I have a sequential model that consists of a collimated beam upon a diffraction grating, which then hits two cylindrical lenses and the 3 different orders from the diffraction grating create lines on the image plane. I am trying to create a macro where I can either export the data or create a graph in Zemax that tells me the X and Y spot sizes (instead of the RMS as it is a line) of the field with varying period of the grating. I am able to calculate the X and Y spot sizes for each order, but I am unsure how to do two things:

  1. Extract the property ‘period’ of the grating from Lens Data (lines/um) in a ZPL macro. I have tried using SPRO, but cannot find the correct column to correlate to the period being extracted. I am able to extract the radius and the semi-diameter, but not the lines/um.
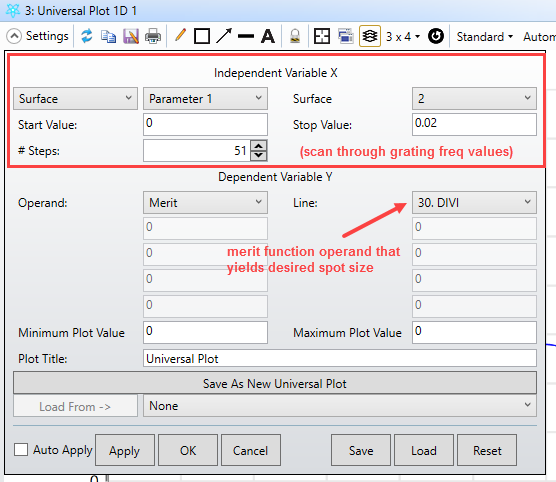
  2. Create a graph of the x and y spot sizes against period in Zemax. Can I do this using Universal Plot? If so, how? Or is better to extract the data and read into matlab?


Many thanks, 
Eleanor

icon

Best answer by MichaelH 11 May 2022, 18:31

View original

4 replies

Userlevel 6
Badge +2

Hi Eleanor,

  1. Since a parameter requires Value1 and Value1 in SURP, you need to use SPRX() rather than SPRO().  So for the Diffraction Grating where the period is Param1, you should use SPRX(2, 10, 1).
  2. The ZPL itself has the ability to create line graphs with the PLOT keyword.  There is an example in the Zemax\Macros folder named PLOT_TEST.ZPL which shows how to use the DECLARE keyword to create X & Y arrays and the PLOT keyword to plot the values.  Unless you are using a single MFE operand like RSCE to calculate the spot size, I would suggest to graph in the ZPL itself since creating a multi-operand Merit Function just to plot spot size might be a little complicated.  If you already have the spot size calculated in the ZPL macro though and you don't want to go use the PLOT keyword, you can also use a ZPLM operand in the Universal Plot to return the spot size and allow the Universal Plot to handle the graphing.

Hi Michael, 

That information was really helpful thank you! 

How would I go about changing the period in the lens data editor inside the ZPL macro, in order to make the graph? I suppose I will have to change the period, then optimise inside the macro if I want to make a plot. I am currently using the TRAX and TRAY commands for my three configurations (orders) in the merit function editor. How would I go about performing these in the ZPL macro?

Thanks, 
Eleanor

Userlevel 6
Badge +2

Hey Eleanor,

You can use SURP surf, 10, new_period_value, 1 to change the Param 1 (Lines/um) value.  When you say “optimize inside the macro”, depending on what you’re trying to optimize for, you might be able to use a Marginal Ray Height solve on the second to last surface to move the image plane to the paraxial focus, marginal focus, or any value in between.  This would be quicker/easier than trying to optimize inside a FOR loop.  The TRAX/TRAY operands are designed to be populated directly by the Default Merit Function Wizard (there is a specific order these operands need to be in to be properly calculated).  So, I would suggest using the Wizard to populate the MFE and then you can use OPER(row, 10) to get the value of the TRAX/TRAY value.  Before you read the OPER(row, 10) value, you should call MFCN() to update the merit function.

Userlevel 7
Badge +3

@Eleanor:  If you already have the spot size value calculated in the merit function, I think it would be far simpler to use the Universal Plot to create the graph:

Regards,

Jeff

Reply