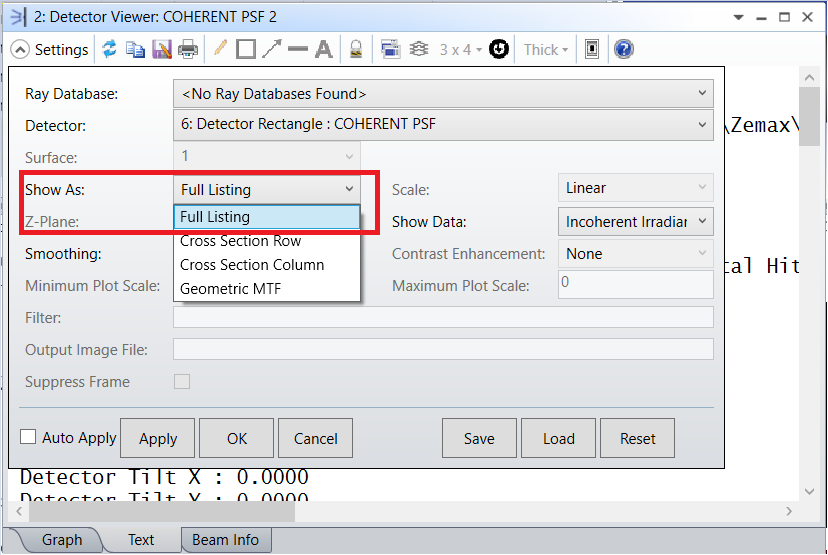
I am trying to export the incoherent irradiance information from the detector viewer along with x,y coordinates. Cross section row/column option allows only to export either x or y coordinate at a specific row/column. How do i export both x,y coordinates with irradiance at each coordinate? The detector grid size is 250x250 pixels.
Exporting detector data
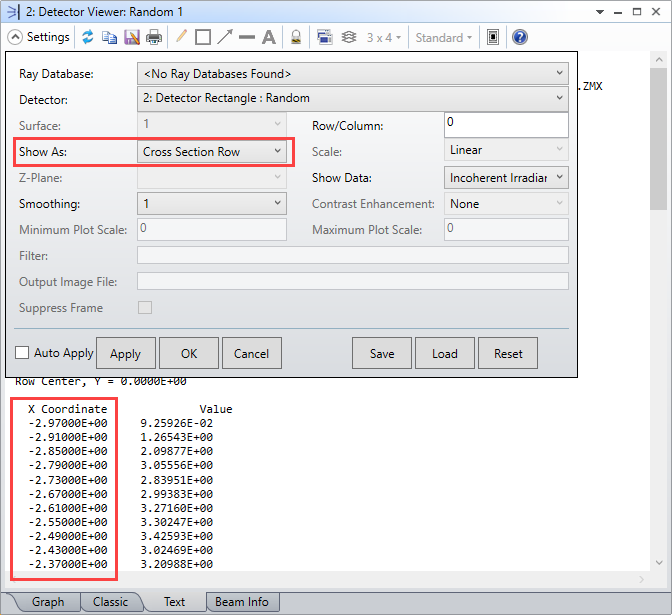
Here’s one option if you do have access to Matlab. You can easily extract the x and y pixel coordinates from the Cross Section Row and Cross Section Column results as shown on the Text tab:
Import these 1D pixel coordinate vectors into Matlab, then use the “meshgrid” function to create a 2D array for the x pixel coordinate and a separate 2D array for the y coordinate. These arrays, combined with a 2D array of the irradiance values, should give you what you need.
Of course you can also create the x and y pixel coordinate vectors by simply using the starting value and the pixel spacing.
Regards,
Jeff
Unfortunately, I do not believe there is a capability within Zemax to export the irradiance data in X/Y coordinate values. Hopefully someone on the Zemax team can comment if I am wrong. In the past, I have had to convert the pixel values to X/Y coordinate values in post processing using Matlab.
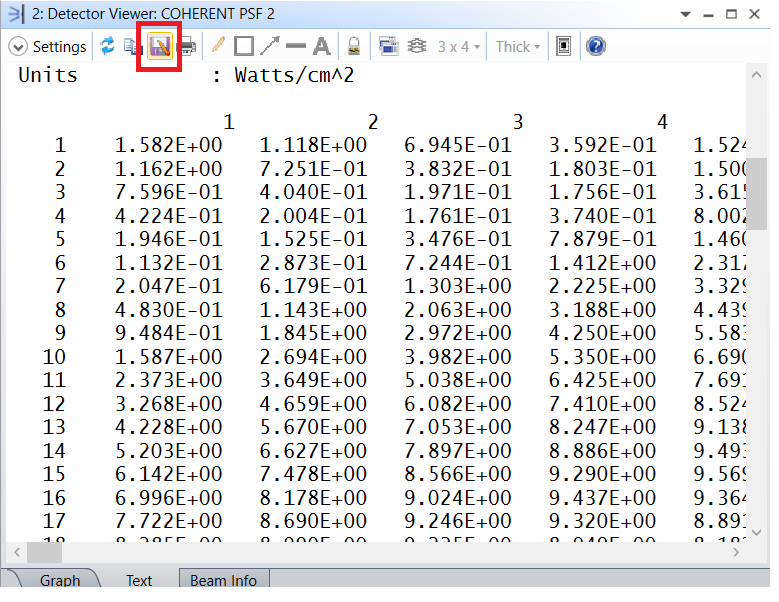
The text tab includes only irradiance data at each PIXEL. What I need is irradiance along with X/Y coordinate values.
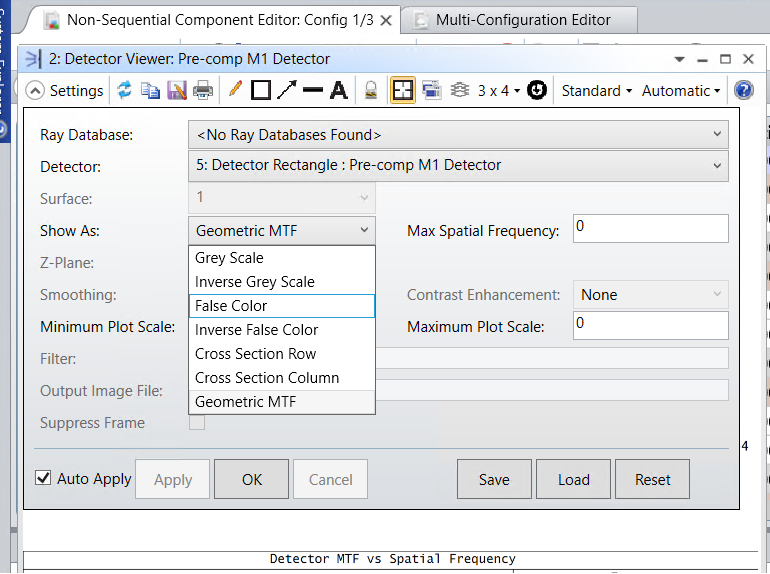
The False Color option you have highlighted in your image is equivalent to the Full Listing option.
If you are using False Color, or any of the equivalent plots, going to the Text tab will allow you to export the irradiance data at each coordinate.
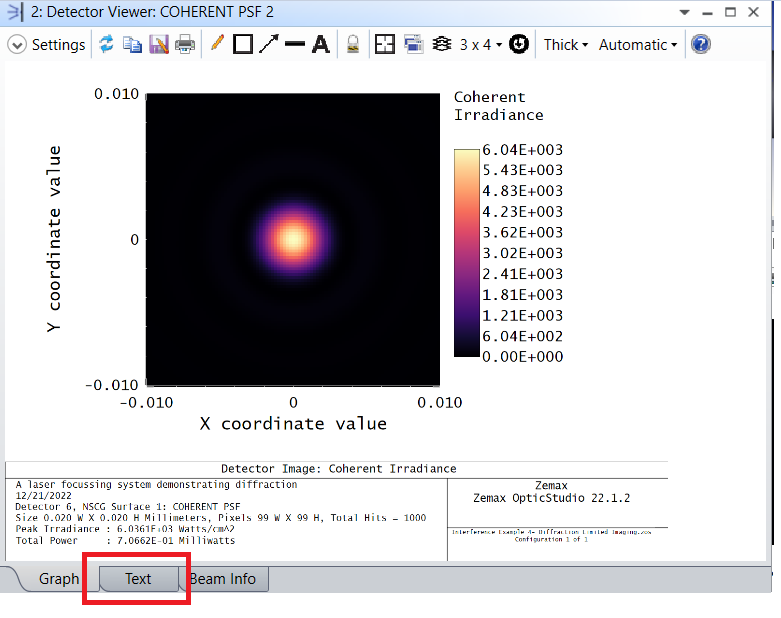
This will export the data as a .txt file.
Reply
Enter your E-mail address. We'll send you an e-mail with instructions to reset your password.