Solved

Encircled Energy Plot in a Non-Sequential Scatter Analysis

  • 6 April 2021
  • 4 replies
  • 267 views

Userlevel 2

I perform a scattering analysis of my system in non-sequential mode, where I am interested in the scattered light (not the main beam) on a detector. The scattered light on the detector has a peak in the middle and drops off to the detector edges. I would like to better understand this irradiance distribution on the detector. In sequential mode I would use the Encircled Energy Analysis. Is there anything similar in non-sequential mode?


My first idea was to use a mixed sequential/non-sequential system, but this does not seem to allow scattering analysis.


Many thanks


scatterplot.png
icon

Best answer by Csilla Timar-Fulep 6 April 2021, 18:45

View original

4 replies

Userlevel 5
Badge +2

Hi Markus,


Thanks for yoiur question here on the forums!


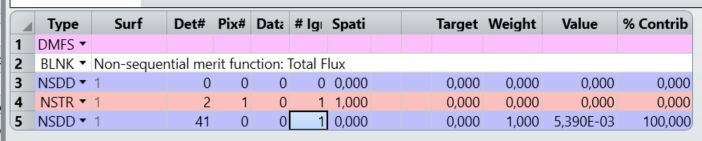
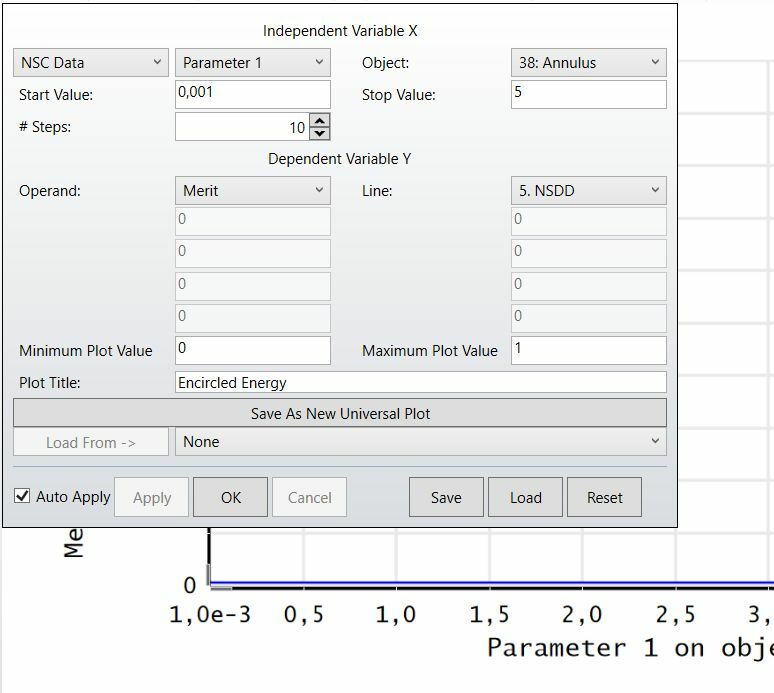
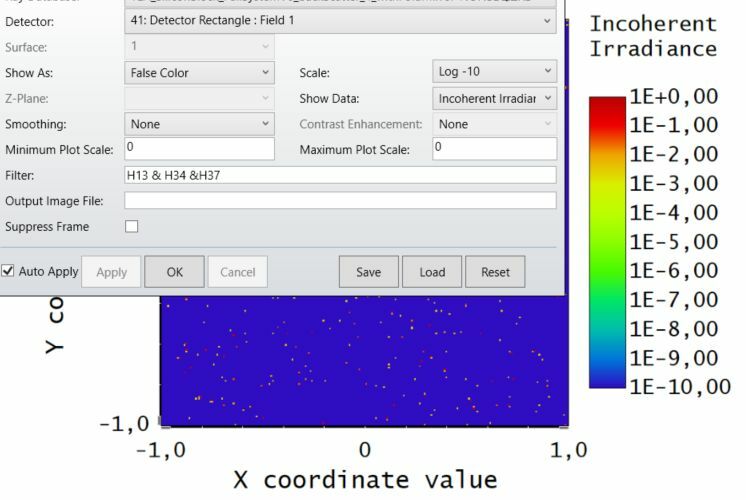
One way to get a similar plot as the sequential encircled energy plot in the non-sequential mode would be to use an obscuration and the Universal plot. With the obscuration you can block the rays / energy outside of a specific radius, so you can determine how much energy reaches your detector within that specific radius. You can use the NSDD operand for this. If you know the overall power on the detector without the obscuration, then you can use the DIVI (division) operand to determine the fraction of energy enclosed by that specific radius. Finally, you can use the Universal plot to change the obscuration size as the independent variable and then you can plot the encolsed energy fraction as the dependent variable.


You may read more about how to use the NSDD operand with the Universal Plot in this knowledgebase article:

How to use the NSDD operand with the Universal Plot · MyZemax


Regarding you idea about the mixed mode solution, sequential rays cannot split within an NSC group – only the primary ray path is considered. Also, in Sequential Mode, a deterministic ray path is required, and only the number of rays launched (no more) may reach the image plane (ray splitting could potentially increase the number of rays which eventually reach the image plane). Because of the deterministic ray path criteria, bulk scattering is not possible either, as it would require a probabilistic approach.


You may find more info about this in the following knowledgebase article:

How to model a mixed sequential/non-sequential system · MyZemax


Please let us know how this solution works for you or if there are any other questions. We’re happy to help!


Best,

Csilla

Userlevel 2

Dear Csilla,


thank you for your quick response and the solution idea. Unfamiliar with Universal Graphs and the NSDD function, it took me a while to figure this out.


Now I have the Universal Graph working with an Annular aperture, where I scan the radius in the Universal graph.


The NSDD function takes the output of a detector. However, it does not seem to consider the filter string (e.g. H13 & H34 &H37) of the detector. Is this observation right? Is there a way to consider the filter string to avoid any strange rays to my detector? Or can I consider the filter string in the NSTR function?


Below some screeshots to show what I have done.


  • The detector with the filter string

  • The merit function with NSTR and NSDD

  • The Universal Graph settings


Many thanks


Markus


detectorsettings.jpg
Userlevel 5
Badge +2

Hi Markus,


Thanks for your your follow-up question.


Yes, you are correct with your observation. Unfortunately, currently the filter strings are not taken into account when using the NSDD operand. The problem is that currently filter strings are not supported without saving a ZRD file, because all of the detectors are 'lit up' while tracing the ray, while the filters only apply after the entire ray path has been computed. 


This has been raised before by other users, and there is an open feature request for it, so I have gone ahead and voted for that feature request in our internal system on your behalf.


Please keep in mind that feature requests are weighed based on impact, difficulty to implement, and the number of users who request it. A request is not a guarantee that the feature will be added to a future release. However, these feature requests are very important to us and shape the future of OpticStudio, so we appreciate your input regarding desired functionality.


Thanks for bringing this to our attention again!


In the meantime, the most efficient workaround is to work through the API. You can use MATLAB for example to establish a connection to OpticStudio and run a series of ray traces while saving the ray data as a ZRD file and applying filter strings. Then, you can plot the data calculated based on those ray files.


To move forward with the workaround using the API, I would suggest to check out these forum threads about how to pull detector data from the API:


Methods for extracting detector data through the API · MyZemax


Accessing filtered detector data with ZOSAPI · MyZemax


How can I pull Peak Irradiance or Total Hits from the Detector Viewer analysis in the API? · MyZemax


For more information about how to use ZRD files and apply filter strings specifically, please check out the sample code of Example 10 - NSC ZRD Filter String:


Apologies for the inconveniences!


Best,


Csilla

Userlevel 2

Dear Csilla,


thank you for your quick response and explaining the options I have.


Instead of using the filter strings, I have now included an additional annulus to take out the unwanted rays. This works quite fine and gives me the same result as the filter strings.


With this work-around I could now create a an equivalent graph to the encircled power graph in sequential mode. For this I have used NSDD in the Merit function and a 1D Universal Graph.


Best regards and thanks for the good support


Markus

Reply