Hello everyone,

I got an Excel-sheet with beam information, it is attached, which I would like to convert to a suitable .DAT file for the Object type “Source file” in the non-sequential mode. I understood it like this: in the first line you determine the number of rays and the unit, I use “mm” so I wrote a 4. From the second line, my beam-data starts. The columns 1, 2 and 3 determines the coordinates x, y and z, the columns 4, 5 and 6 the angle in the different room directions. The next columns give information about the value of the power, you can add another column for the wavelength, I only work with one, so I left it out and add the wavelength over the system explorer.

My question belongs to the angle, I couldn’t figure out how I write it correctly, so the program can propagate the light. It appears an Error Message: Invalid direction cosines for ray 1 in source file. All angles are added the same way, so it appears for all rays.

So how should convert the angle so Zemax can work with it.

Thank you very much for your time and I hope you can help me further

@Florian B.


First, remember that direction cosines squared should sum to one. Second, it really depends on what your angles are and how they are defined. In your file, I see a column X-axis (deg). How is this angle measured? Is this the angle the ray makes with the X axis or is it the angle of the ray in the X-Z plane? Because those are not the same thing.

____________________________________

If your angle, that I will refer to as x_axis,  is truly the angle that the ray make with the X axis, then, the first direction cosine l is simply:

l = cos(x_axis)

Then, if Y-axis (deg) is truly the angle that the ray makes with the Y axis, then, the second direction cosine m is simply:

m = cos(y_axis)

And finally, we now that:

l^2 + m^2 + n^2 = 1

Therefore, the last direction cosine is:

n = sqrt( 1 - l^2 - m^2 )

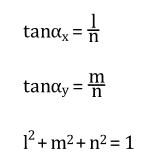
If instead your X-axis (deg) is the angle of the ray in the X-Z plane, then you have those relations from the Help File (Field Angles and Heights section):

where alpha_x and alpha_y are your X-axis (deg) and Y-axis (deg) respectively.

Some time ago I wrote a Python script to write binary sources, perhaps it can help you:


Take care,


David


@David.Nguyen 

Thank you David,

I got the beamfile from a company and I tried to change so it would look similar to the Source files which were given by Zemax. I got an Excel file from the company which looks a bit different. Would you mind to look over it once? After what you said, I assume the angels are between the X-Z plane and Y-Z plane.

Furthermore, we are speaking over an illumination profile, in case it makes a different. I am really sorry for all this inconvenience. I would look now over what you said before.

Thanks again,

Florian


@Florian B. 


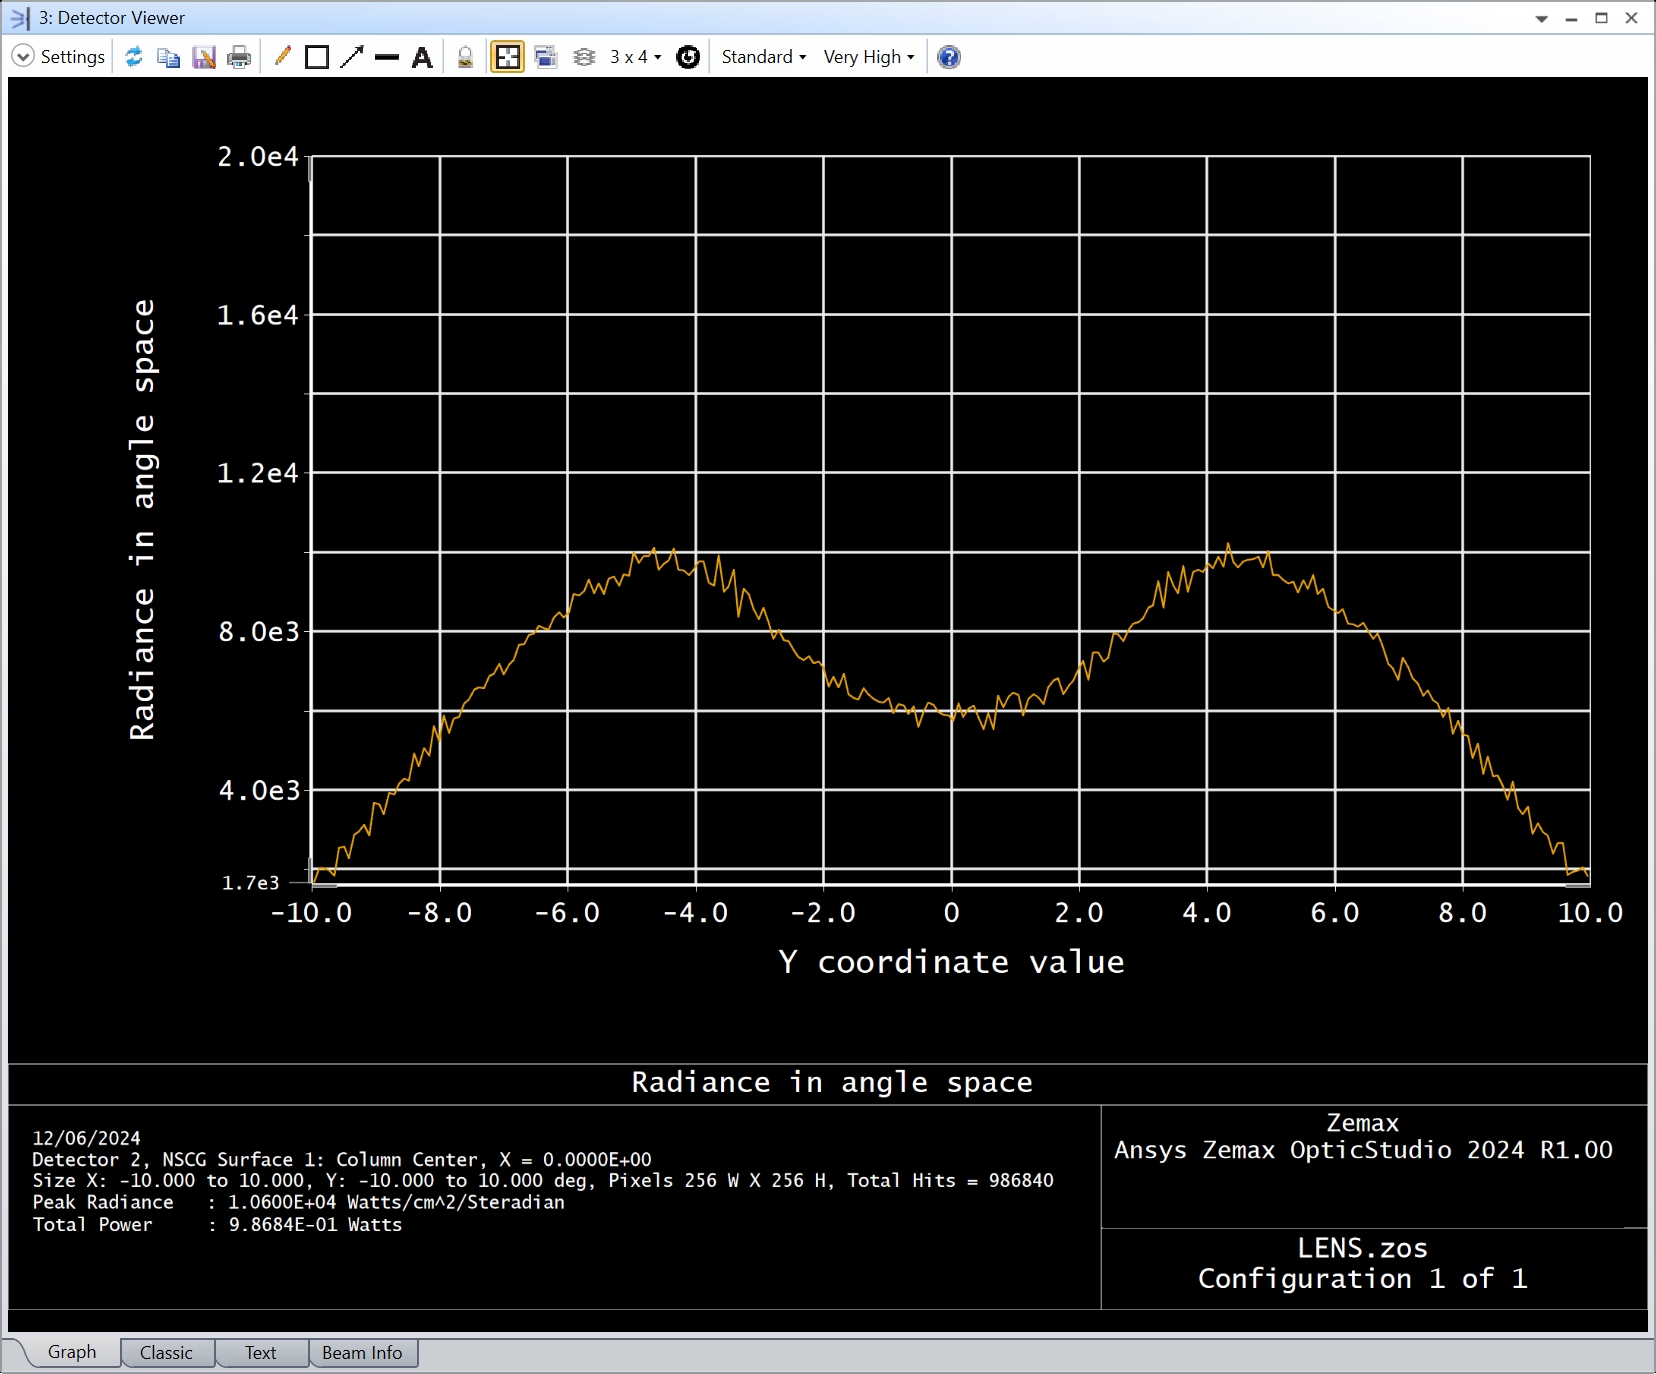
I had a second look at your file, but I’m not sure what you are expecting me to do. One thing could be to check with the company to agree on the definition of those values. Another thing that comes to my mind is the Source Radial object in OpticStudio. Since the X/Y profiles are relatively similar, one could use this Source object to represent it. The Source Radial has additional parameters where for a set number of angles one can define a relative intensity. I eyeballed the values of your plot in the spreadsheet and made the example below. You could also do a fit, and input those values into OpticStudio. Note that I chose 46 points, such that I get a 2 degrees interval between the positions. Past 10 degrees, I kept the other positions at 0.0.

But, otherwise, you should still be able to create a source file from your spreadsheet. Let us know otherwise.

Take care,


David


Reply