Solved

Curious impact of analysis rays number in simulations

  • 30 August 2023
  • 5 replies
  • 119 views

Hi everyone,


I am at a dead end with my zemax model, and I would be grateful if someone can share me its experience concerning my problem.

The number of Analysis ray has an impact on my simulations, when it seems incoherent in reality.
In fact, if I average 10 acquisitions with 10^5 rays (whose results are quite repeatable), I have a different result than if I directly send 10^6 rays (also repeatable).
The idea that the higher the number of rays, the closer the model is to reality does not seem to be correct here, given that 10*10**5 rays and 10**6 rays give different results.


I found no answers on the definition of the source I use (source gaussian), nor the definition of 'analysis ray’, that is why I am here asking for your kind help.


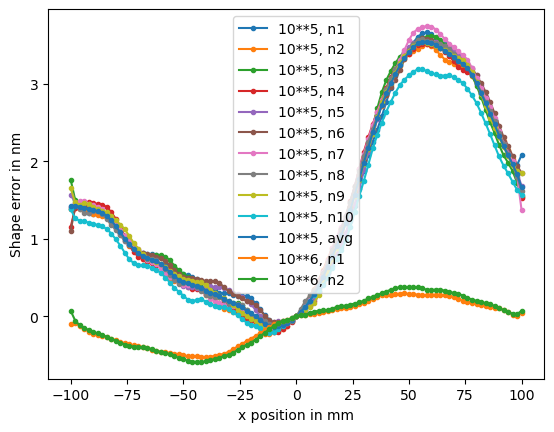
Below are the results mentioned above, it is the plot of the shape error of the central profile (measure of a modelled mirror, whose length is 200mm). Each color is the result of a different simulation (except the 11th which is the average of the top 10), using the number of analysis ray indicated (10**5 or 10**6).

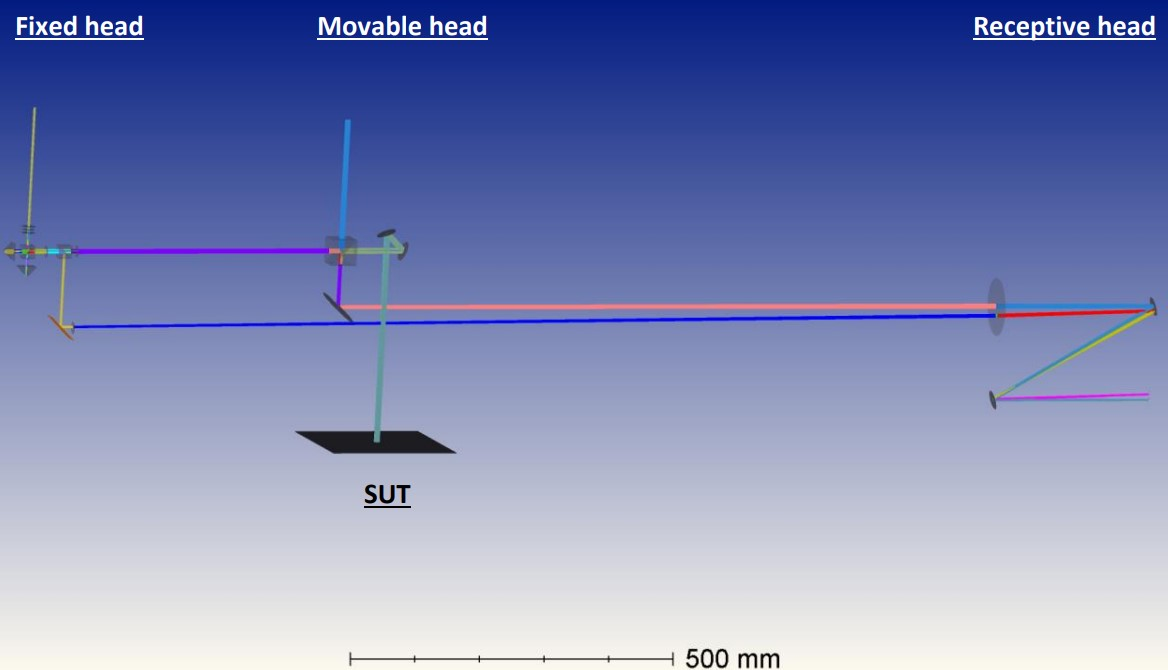
To present my use of zemax, I am using it in non sequential mode in order to model an instrument that measures mirrors. This instrument is a profiler, measuring the slope of a central profile of a studied mirror.
With python code, I can simulate scans and obtain a 2D map (a slope error profile, or height error if integrated) of a mirror modelized, reproducing what the real instrument should do.
I have upgraded my python code to simulate successive scans using different parameters (modifications of position/orientation/shape of certain objects or group of objects for example) and then plot the height error depending on the parameter of the study (in abscissa is the measurement position on the mirror).


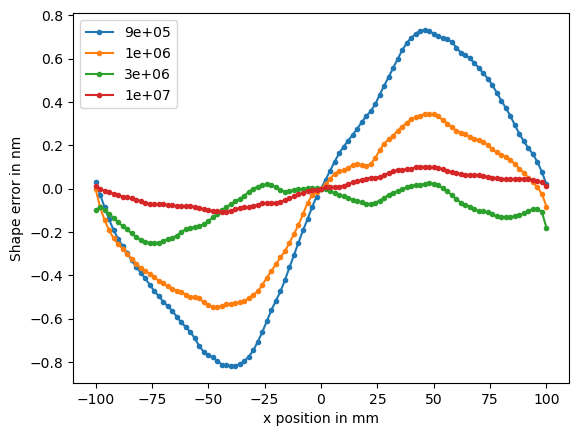
Surprisingly, a 3rd order polynomial appears and its amplitude depends on the number of rays, which cannot be explained with physical laws. The appearance of the polynomial itself is not surprising depending on my model, but it should not depend on the number of rays.


Below I plot a similar graph than the one above, using different number of analysis rays.

Please let me know if you have any idea about the source of this problem, or if you have some research ideas in mind.

Thank you for your time and consideration, I remain available to share more results or details if needed.


All the best,

Théo.

icon

Best answer by David.Nguyen 30 August 2023, 17:12

View original

5 replies

Userlevel 7
Badge +2

Hi @Théo S-L,


Would you have a minimal example that demonstrates the issue to share with us? Obviously, we can see that you’ve worked on this model for a long time, and you know about it very well. But, at least for me, it is quite difficult to understand based on the information that you shared.

These are some pointers and question that I think will help you get an answer:

  • How do you do the raytracing in the ZOS-API? Are you using the BatchRayTrace or the NSCRayTrace? If the latter, have you tried to use the method ResetRandomSeed() just in case?
  • Have you played with the Sampling Method of your source (Sobol vs Random), and if so, what difference does it make?
  • I’m not too sure if its relevant because I don’t understand how you get the shape error but do rays get lost during the tracing?

Hopefully someone will be able to help you.

Take care,


David


Hi David,

Thank you very much for taking the time to answer me.

I dont know what details I have to share to be clear enough without flooding the content.


I present below the zemax model I am using (SUT means Surface Under Test, so here a mirror). The movable head passes above the SUT taking successive acquisitions of the punctual slope (each measure is a point in the curves presented on the first post).
For example, the scan of a cylinder mirror should begin to touch the sensor at the very bottom, then move upwards. A perfect plane mirror should be read by the sensor by an immobile point in its center. For other mirrors, the distance between the center of the sensor and were the beam touches it will indicate the punctual slope. I hope this will help you a little.
The slope measurement comes from a convergent lens (or FT lens) in the receptive head which only transmit the slope on the mirror at the measured area, and an open penta-prism in the movable head.

I will be happy to share more details if needed.

Concerning your list;

  •  I’m using the NSCRayTrace (zNSCTrace) with the parameter 'randomSeed’ set to 0. But thanks for you idea, I will try using ResetRandomSeed() just to be sure. Or also try BatchRayTrace.
  • Its the first time I am learning about the Sampling Method, I will also go that way for my next tests !
  • Only a few rays (considering how many are simulated during the process) touch on the sensor. I had to increase the Maximum Intersection per ray for my model to work.

Even if I do not find a solution, your answer gave me new insights so thank you, I will test all of that.

Have a nice evening.

Théo.

Userlevel 7
Badge +3

Hi Theo,

Just to be clear, do you see this problem only when using ZOS-API for the automation, or when using the UI itself?

  • Mark

Hi Mark,


To plot one of the curves shown in one of the first two figures, I used ZOS-API. In order to do this, I need to take 101 points, meaning my python code calls zemax 101 times, with 101 different positions of the movable head.

Then I analyze it: I substract a 1rst oder polynomial, a reference, and I integer the curve.

To do the same using only the UI itself would require at least 10 points, and an investment of a considerable amount of time (modifying my code for a manual entry). Moreover, I'm afraid of introducing new variables (not doing exactly the same than python), and that would call into question any conclusions I might draw.

I understand that I need to identify the source of my problem and your question is legit. I'll do this study as a second step if I don't get answers with simpler/quicker tests. 


By the way, thank you very much for reminding me this approach!

Best regards,

Théo.


Hi David and Mark,

Thank you again for your help!


I solved my problem thanks to your comment about the sampling method David,
with the random method I don’t have the issue.
Moreover, I understood its source thanks to your article 'Understanding Sobol sampling’ Mark.

I just have to send 300 times more rays to maintain the desired precision, which is another problem.


Thanks again and have a good day !

Théo.

Reply