Hi everyone,
I am at a dead end with my zemax model, and I would be grateful if someone can share me its experience concerning my problem.
The number of Analysis ray has an impact on my simulations, when it seems incoherent in reality.
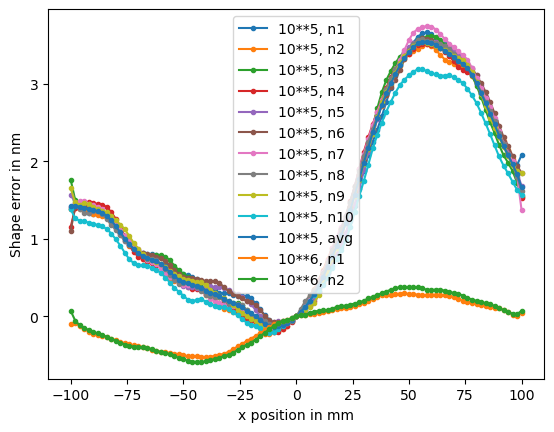
In fact, if I average 10 acquisitions with 10^5 rays (whose results are quite repeatable), I have a different result than if I directly send 10^6 rays (also repeatable).
The idea that the higher the number of rays, the closer the model is to reality does not seem to be correct here, given that 10*10**5 rays and 10**6 rays give different results.
I found no answers on the definition of the source I use (source gaussian), nor the definition of 'analysis ray’, that is why I am here asking for your kind help.
Below are the results mentioned above, it is the plot of the shape error of the central profile (measure of a modelled mirror, whose length is 200mm). Each color is the result of a different simulation (except the 11th which is the average of the top 10), using the number of analysis ray indicated (10**5 or 10**6).

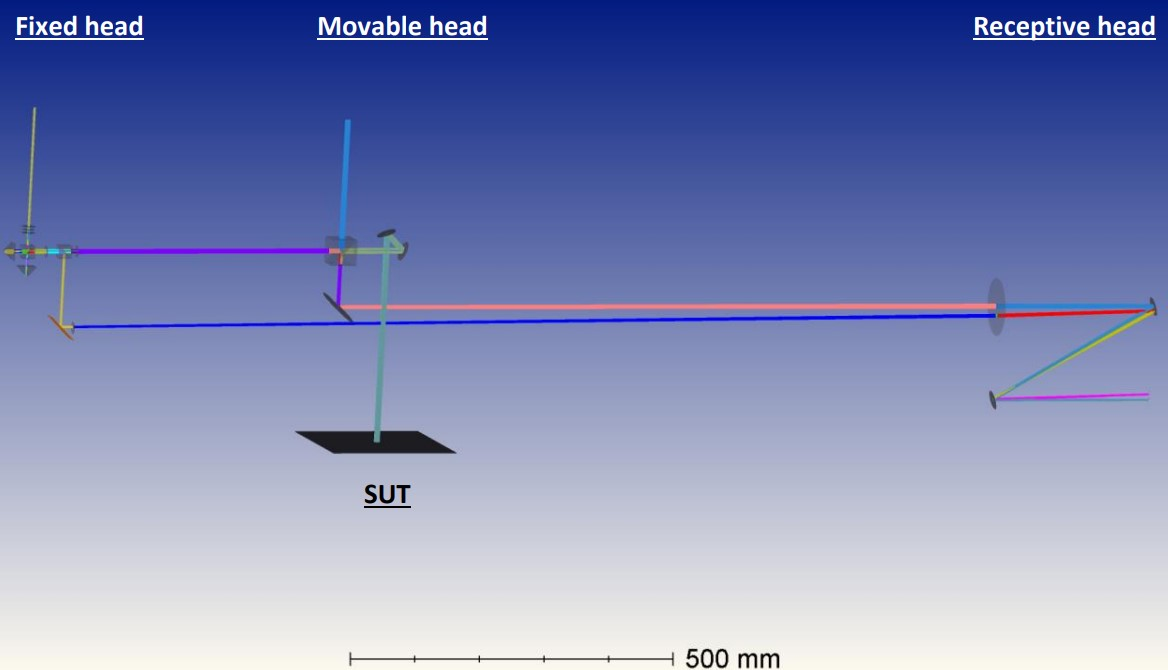
To present my use of zemax, I am using it in non sequential mode in order to model an instrument that measures mirrors. This instrument is a profiler, measuring the slope of a central profile of a studied mirror.
With python code, I can simulate scans and obtain a 2D map (a slope error profile, or height error if integrated) of a mirror modelized, reproducing what the real instrument should do.
I have upgraded my python code to simulate successive scans using different parameters (modifications of position/orientation/shape of certain objects or group of objects for example) and then plot the height error depending on the parameter of the study (in abscissa is the measurement position on the mirror).
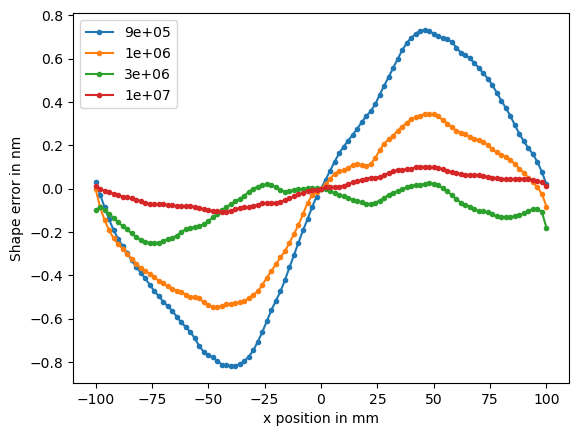
Surprisingly, a 3rd order polynomial appears and its amplitude depends on the number of rays, which cannot be explained with physical laws. The appearance of the polynomial itself is not surprising depending on my model, but it should not depend on the number of rays.
Below I plot a similar graph than the one above, using different number of analysis rays.

Please let me know if you have any idea about the source of this problem, or if you have some research ideas in mind.
Thank you for your time and consideration, I remain available to share more results or details if needed.
All the best,
Théo.


