


When we run a tolerance analysis, in the report, there is always a section for 'Estimated Performance Changes based upon Roo-Sum-Square method'. Here let's give an simple math to explain why this can be considered as 'worst case' in tolerance.
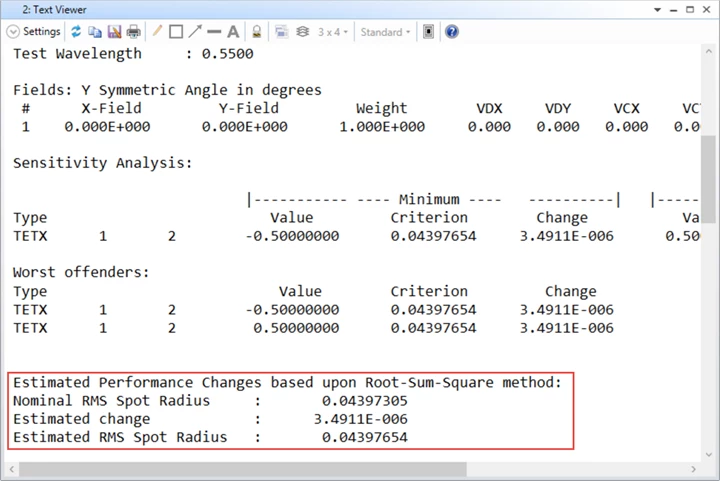
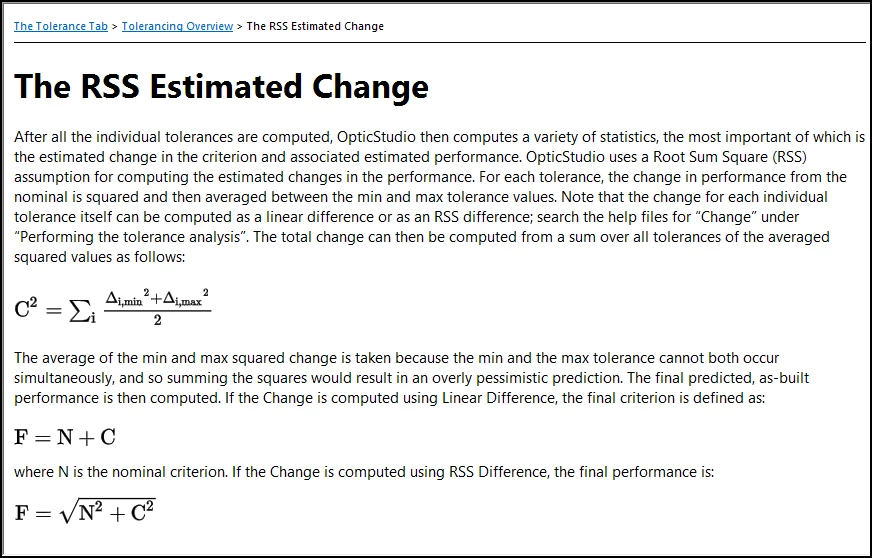
In Help file, we can explanations as shown below. Normally, this value can be considered as the criterion of the worst case of the system after consider tolerance. If the RSS performance is acceptable, then it's very likely the final really-fabricated system can meet designer's goal.
Here we will use the 'Stack Up' question to explain the calculation of RSS.
Stack Up question
Here is the question:
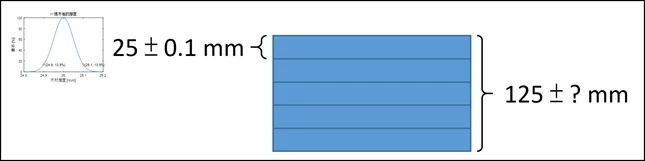
Imagine we have 5 wood plate to be stacked up together and we would like to estimate the total thickness of the the stack. We already know each wood plate has different thickness (which is error!). The thickness of each plate is 25 with an error of +-0.1 mm. Assuming the probability of thickness of a randomly-taken plate is a normal distribution. The center is 25 mm, the probability at 25.1 and 24.9 mm is e^-2, whhere it is just at twice the standard devication (sigma) from the center.
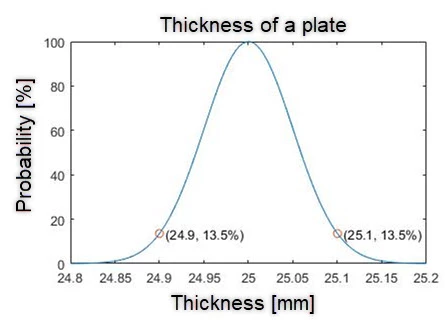
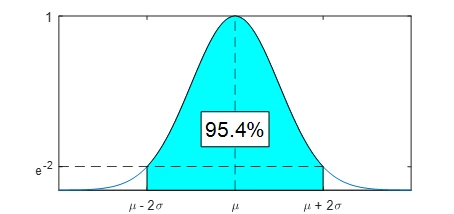
As a result, we can say the possibility I get a plate whose thickness is with error smaller than +-0.1 mm is 95.4%.
OK. Now the question is what is the thickness if we stack 5 plate together.
The anwser is:
The total thickness is also a normal distribution. The center thickness is exactly 125 mm, which is simply summation of the 5 plates' average thickness 5*25. And the probability at 125.224 and 124.776 is e^-2.
The devation amount 0.224 is caluclated exactly by root sum square (RSS)! We can calculate it by type the follwoing expression in excel:
sqrt(0.1^2*5)
and get result of 0.224.
Here is a nice explanation of this math: https://en.wikipedia.org/wiki/Sum_of_normally_distributed_random_variables
Note it's important to remember the assumption of this analysis method is:
1. The error of each tolerance variable is normal distributed.
2. Tolerance variables are independent to each other. The error of one wood plate will not change the error distribution of the other plate.
Based on this and back to our optical system, when looking at Estimated Performance Change, we can say, if the each considered tolerance all vary in normal distribution way and they are independent to each other, the final system's criteirion has possibility of 95.4% to have error smaller than the RSS value.
Example
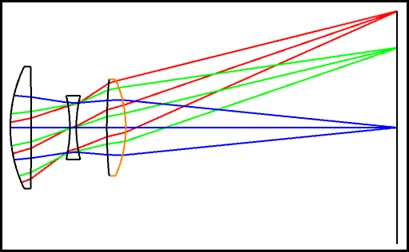
Let's take the built-in example to experiement.
\Zemax\Samples\Sequential\Objectives\Cooke 40 degree field.zmx
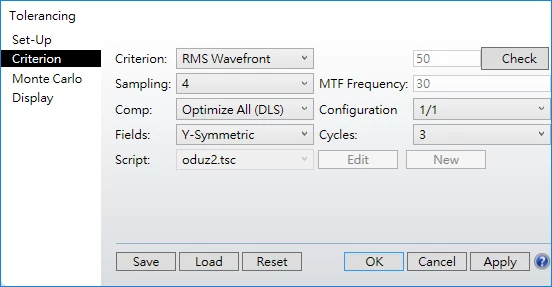
In Tolerance Data Editor, for simplicity, we only input 6 tolerance operands for tilt/decetner of first and second lens.
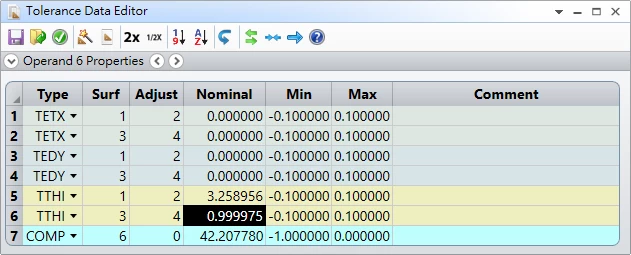
Here is the tolerance setting.
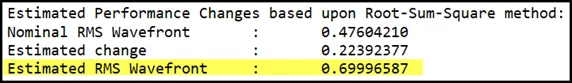
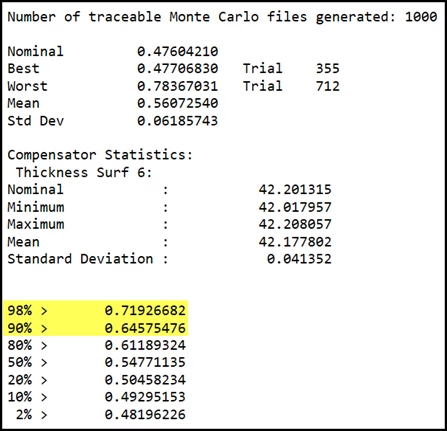
After running tolerance, we get RSS criterion of 0.7 as below.
That is the value located in between 90% and 98% as shown below.
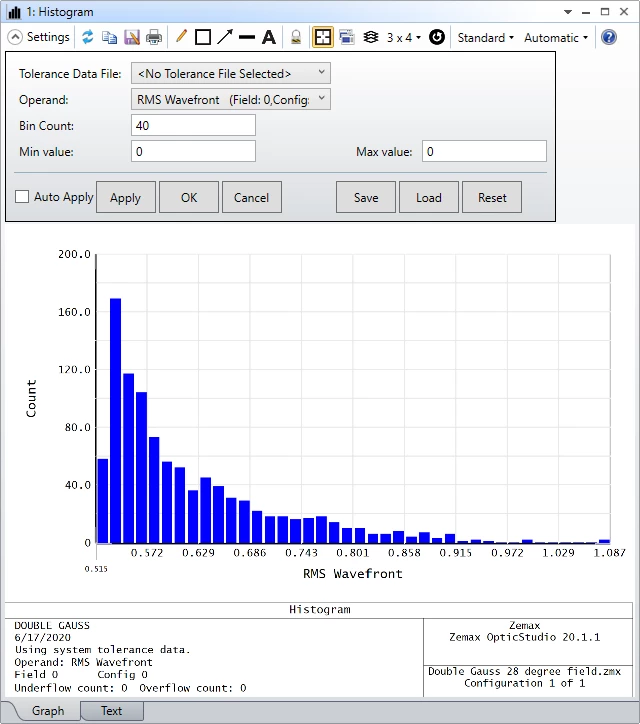
Here is the result of Histogram.
Note the assumption will not be as ideal as the example for stacking wood plates. For example, the tilt and decenter may not be perfectly independent in how they affect the result performance. Therefore, the RSS analysis something could still be different to Monte Carlo analysis, while it should definitely be a nice 'estimation' when we only do sensitivity analysis.