Solved

Angular spread of rays in collimated space

  • 28 September 2023
  • 7 replies
  • 132 views

Userlevel 2

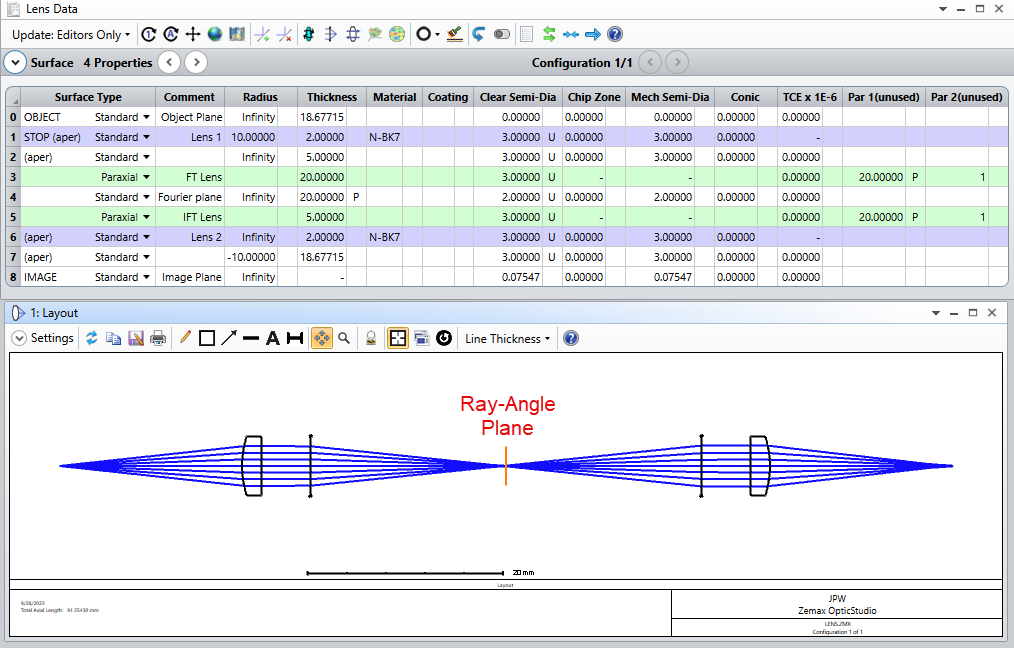
An optical system composed of two lenses operates between two finite conjugate planes. The first lens collimates the image from the object. The second lens focuses the collimated image into an image.

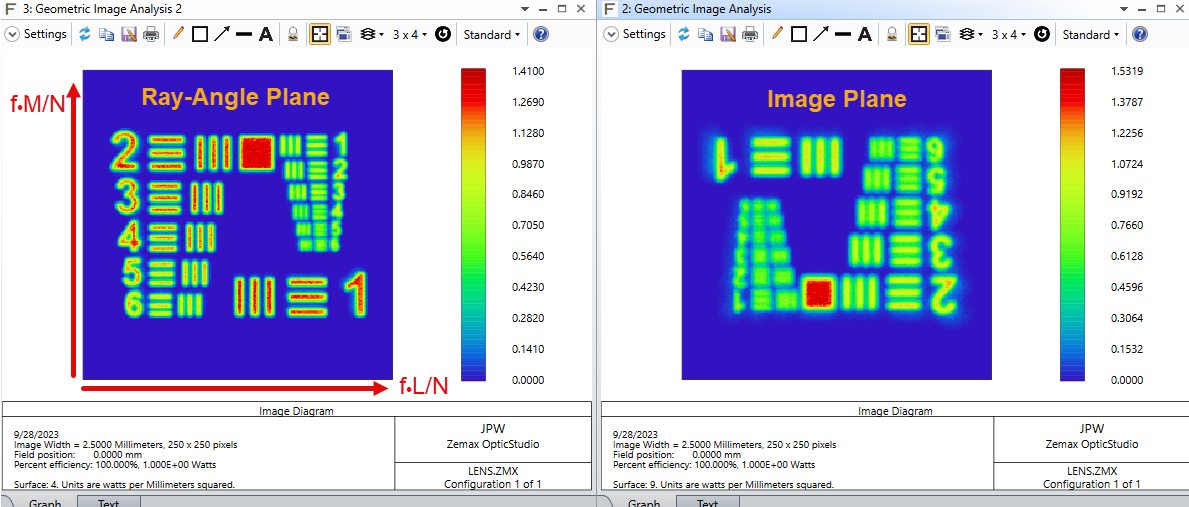
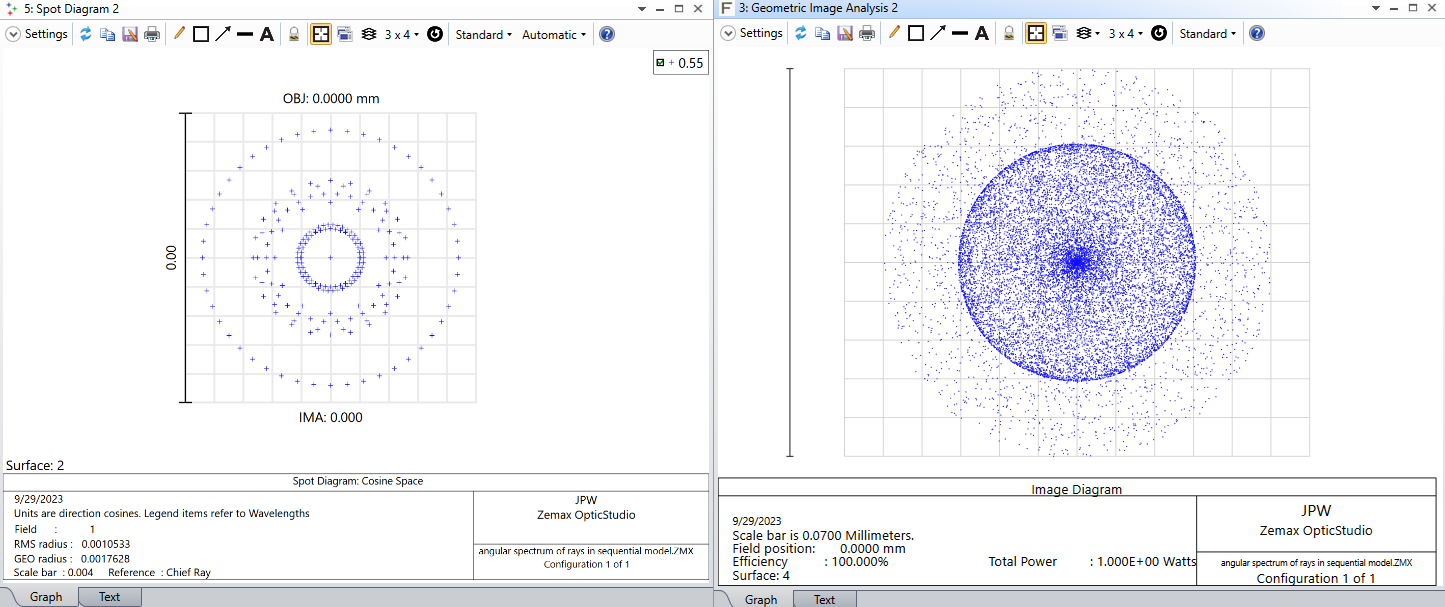
I would like to extract the angular spread of the rays in the collimated space. How can that be done in sequential mode? Is it possible to set up a detector betwen the two lenses? 

icon

Best answer by David.Nguyen 28 September 2023, 17:14

View original

7 replies

Userlevel 7
Badge +2

Hi @Jonasz,


Wihtout going into programming, would it be enough to use the Standard Spot Diagram with Direction Cosine checked in the settings? From the direction cosines it should be possible to retrieve the angular distribution. In the Help File, OpticStudio has a section Field Angles and Heights, which reads:


OpticStudio converts x field angles (αx) and y field angles (αy) to ray direction cosines using the following formulas:


Hope this helps.

Take care,


David

Userlevel 7
Badge +3

@Jonasz:

The direction cosine plots on the spot diagrams are helpful, but they only give you data for individual field points, and moreover the raw data points are not available in the text window.  

Sounds like you are interested in obtaining the angular content of an object (i.e., a weighted collection of field points).  I suggest you try inserting a couple of paraxial lenses in collimated space and use the geometric image analysis tool to look at the distribution in the intermediate focal plane (i.e., an angular spectrum plane).  Something like this:


Now you can use GIA to look at the angular distribution of rays in the intermediate focal plane, as well as the real-space distribution of ray intercepts in the image plane.  In this case, when using a paraxial lens, the ray xy-slopes (L/N, M/N) of incoming rays with direction cosines (L,M,N) are scaled by the lens focal length and plotted in real space.  Therefore, the coordinates in the ray-angle plane are simply (fL/N, fM/N).


In this example you can see aberrations from the first glass lens are apparent in the ray-angle plane, while additional aberrations arise from the second glass lens used to form the final image.  Now, if needed, all the raw data is available in the text tab.

Regards,

Jeff

Userlevel 7
Badge +2

@Jeff.Wilde I’m a bit confused. Without the paraxial lenses, assuming we’re talking about a 4f system, there’s already a Fourier plane in between the glass lenses, which contains the angular distribution of the object, doesn’t it? I understand how adding paraxial lenses highlight the contribution of aberrations, but are they needed to get the angular spread?

Also, thanks for pointing out that the direction cosines aren’t reported in the text tab of the Standard Spot Diagram.

Take care,


David

Userlevel 2

Thank you for both answers.

David´s simpler approach was enough for my analysis.

Userlevel 7
Badge +3

@David.Nguyen

I can see the source of confusion, so I’ve edited my response to remove reference to a “Fourier” plane.  Technically, a Fourier plane only occurs in coherent optics, when an object is illuminated by a plane wave and the transmitted (or reflected) light is focused by a lens.  There is no Fourier plane in incoherent optics.  However, I tend to think of a Fourier plane more generally as any plane in which angle information is available, even if it’s not strictly correct.  So, you are right, in a canonical 4f coherent optical system the intermediate plane is a Fourier plane, but again, to see the FT of an object would require monochromatic (or quasi-monochromatic) plane-wave illumination + coherent superposition of the angular spectrum components reaching the FT plane.

In ray tracing, one would often like to see the angular distribution of the rays at some point in the optical system.  If the rays originate from more than one field point, then a paraxial lens is good for this, given that no other direct tool is provided in sequential OpticStudio (other than a simple spot diagram in direction-cosine space).  The approach I describe above, based on the GIA tool, is useful for looking at ray-angle distributions (specifically ray xy-slopes, scaled by the focal length) when the object plane actually contains some sort of an object.  It also provides the spot diagram result by simply using a circle object and setting its field dimension to zero.  Here’s an example comparison:


Sorry for the confusion with the “Fourier” terminology when all that is going on is a remapping of ray slopes to spatial locations with the first paraxial lens, looking at the result with the GIA tool, and then using a second paraxial lens to undo this mapping and send the rays back to their original states.

Regards,

Jeff

Userlevel 3

Just put RAID operands in the merit function.  

Userlevel 7
Badge +2

Thanks for clarification @Jeff.Wilde, it makes a lot of sense.

Take care,


David

Reply