
Best answer by yuan.chen
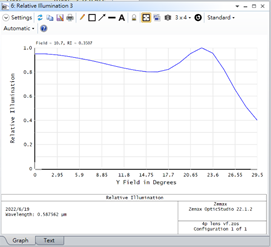
Hi Andrew, I have to admit that I have never seen such a curve before. I could only guess since I don’t have your file. I suspect that you used freeform or even asphere with large zonal variation. The incident angle on image plane might be smaller in the higher RI region/the effective working number is smaller to collect more light. Another possibility is the distortion. If the pincushion distortion is high, it helps concentrate the energy and therefore improve the RI. Though, it’s rare to have such a huge variation over the fields.
I can have a better investigation if you can share me your file. If it’s confidential, you can send me the file by emailing support@zemax.com.
I would like to recommend you to read this material written by our excellent engineer Michael Cheng. He explained how RI is calculated in details.
Enter your E-mail address. We'll send you an e-mail with instructions to reset your password.
Do not provide any information or data that is restricted by applicable law, including by the People’s Republic of China’s Cybersecurity and Data Security Laws ( e.g., Important Data, National Core Data, etc.).
不要提供任何受适用法律,包括中华人民共和国的网络安全和数据安全法限制的信息或数据(如重要数据、国家核心数据等)。

