本文章介紹了:
Field Curvature/Distortion分析的文字區塊中Distortion Focal Length的定義
使用Single Ray Trace驗證
介紹用ZPL中的PLOT、RAYTRACE指令
用ZPL簡單的驗證Distortion Focal Length的定義
文章發布時間:September 23, 2015
系統分析功能中的Distortion Focal Length
當我們在OpticStudio中打開Field Curvature/Distortion分析功能時,會在文字區塊中看到這個參數,有些使用者會好奇這是什麼參數,為什麼他與狀態列上的有效焦距EFFL不同。
請開啟範例檔:\Zemax\Samples\Sequential\Objectives\Double Gauss 28 degree field.zmx
請開啟Analyze Ribbon > Aberration > Field Curvature and Distortion,並記得在Settings中設定使用主波長2,也就是0.587 um。(這是為了與之後我們撰寫ZPL時使用相同的波長驗證)
點擊一下視窗下方的Text標籤,並找到如下的Distortion focal length參數。
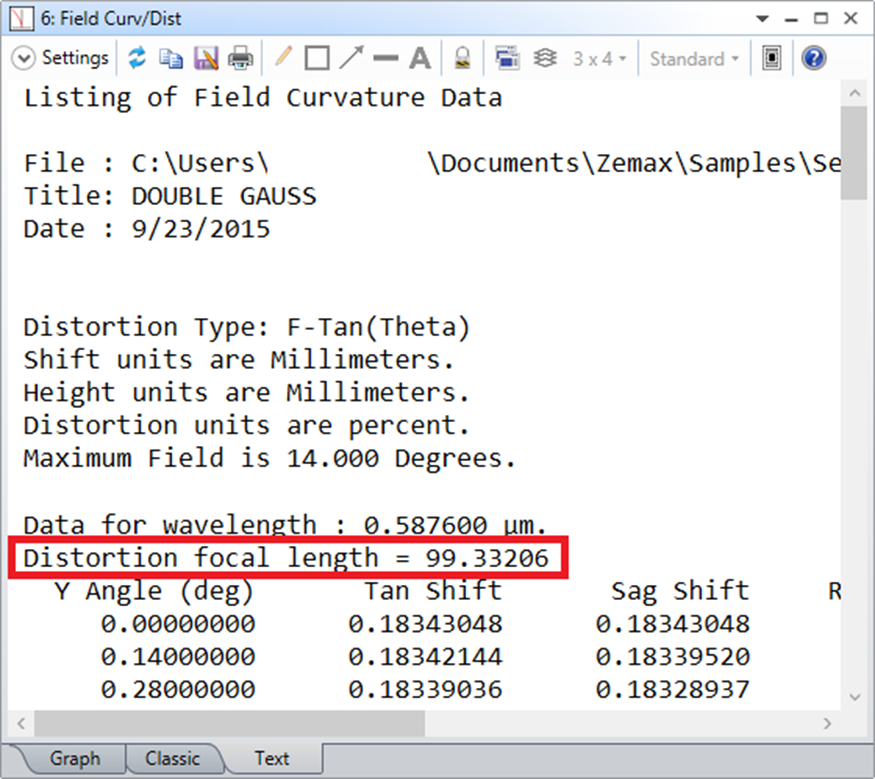
可以很輕易的發現他與整個主視窗下方的狀態列上的EFFL數值不同。

什麼是Distortion Focal Length
要瞭解Distortion Focal Length,首先我們先查看Help檔案。
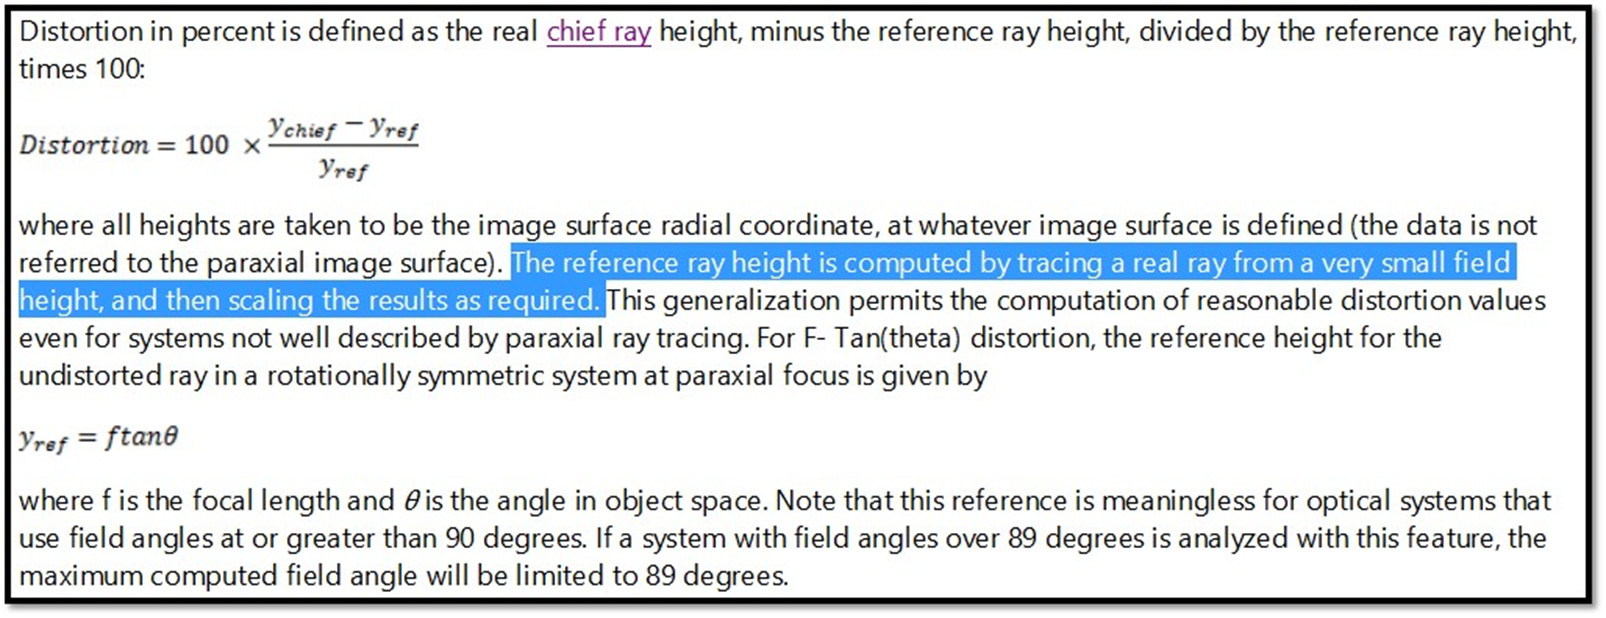
根據上面反白的文字,系統會先追跡小視場,然後其他較大視場的入射光線再根據Yref=f*TAN(theta)放大。
其中f就是在小視場下計算的,我們可以用追跡工具Single Ray Trace簡單的驗證:
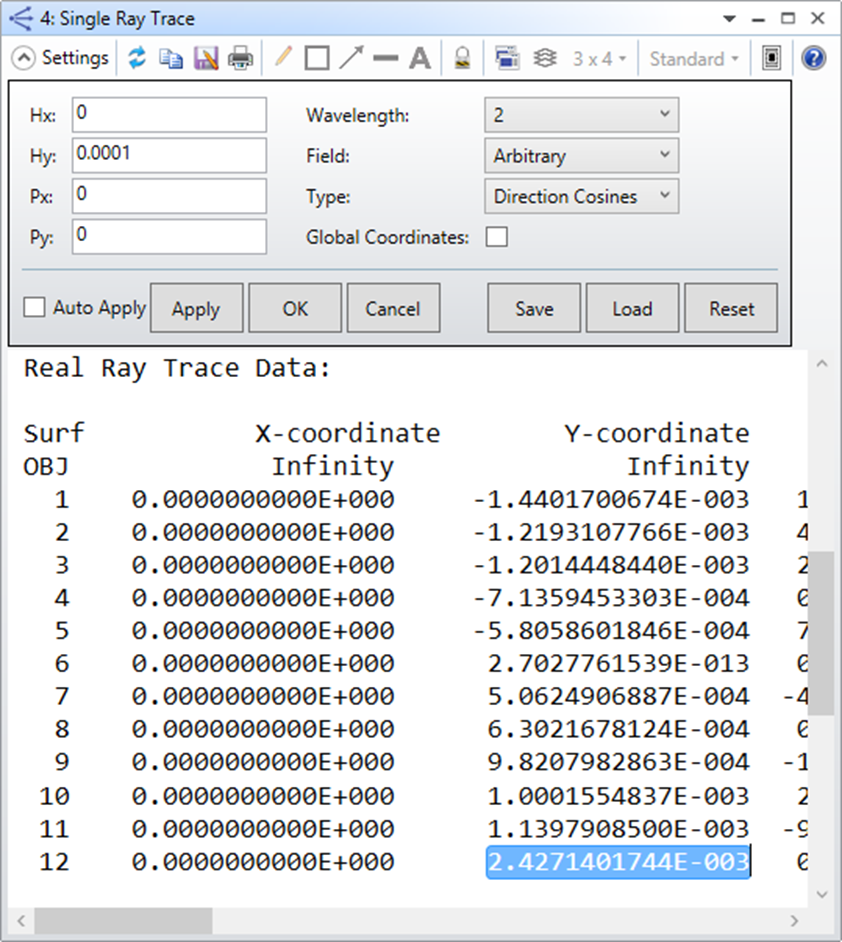
(請注意波長為2)
由於此範例最大視場為14度,因此Hy = 0.0001代表0.0014度,Px = Py = 0代表chief ray,可看到第7個面的像高為2.4271401744E-003。
我們把公式轉換為f = Yref / TAN(theta) = 2.4271401744E-003 / TAN(0.0014 degree) = 99.3320630
可發現與Field Curvature/Distortion分析功能文字區塊所顯示的數字一致。
Zemax編程語言 (Zemax Programming Language)
ZPL是OpticStudio中編程用的語言,可以讀取軟體中大部分的設計數據,並執行各種分析功能,會把分析結果匯出。語言本身也支援矩陣、迴圈、各種數學函數。詳細內容請到Help文件中閱讀。以下我們僅介紹兩個指令。
RAYTRACE
語法格式:RAYTRACE hx, hy, px, py, wavelength
這個功能與OpticStudio中的Single Ray Trace分析功能基本上是相同的。
Hx/Hy代表視場位置
Px/Py代表光瞳位置
Wavelength代表波長編號,對應到波長編輯對話框中的編號
PLOT
語法格式:
PLOT NEW
新增一個新的繪圖視窗,接下來的繪圖指令都會關聯到這個新開的繪圖視窗,每一個繪圖視窗的第一行指令永遠都是PLOT NEW
PLOT TITLE, string
PLOT TITLEX, string
PLOT TITLEY, string
以上分別代表圖表的標題、x軸標題、y軸標題
PLOT RANGEX, minx, maxx
PLOT RANGEY, miny, maxy
以上分別代表x或y軸的最大最小值設定
PLOT CHECK, x_increment, y_increment
定義資料點標記的x與y方向大小
PLOT TICK, x_increment, y_increment
定義圖表上x與y座標軸上最小刻度值
PLOT FORMATX, format_string
PLOT FORMATY, format_string
定義x與y座標軸上顯示數值的格式
PLOT DATA, x_array, y_array, number_of_points, color, style, options
繪圖指令,使用矩陣資料繪圖。x_array與y_array必須一樣大,代表每個資料點的X與Y的數值。number_of_points用來指定要從矩陣中取出幾個點來繪圖。color部分要輸入整數,代表不同的顏色。Style可以指定線條的外觀,例如實線或虛線。Options可以指定是否要畫標記或是線條或是都畫。
PLOT GO
根據前面的PLOT指令,產生圖表
使用ZPL驗證
在軟體中開啟Programming Ribbon > New Macro,貼上以下程式碼並儲存:
! This Macro is designed for Double Gauss 28 degree field.zmx sample
! Define array variables to be plotted
DECLARE x_ang, DOUBLE, 1, 400
DECLARE dis_f, DOUBLE, 1, 400
PI = ACOS(-1)
max_field = MAXF()
! Compute array variables
FORMAT 10.10
FOR j, 1, 400, 1
x_ang(j) = j/400*5
RAYTRACE 0, j/400*5/max_field, 0, 0
dis_f(j) = RAYY(NSUR())/TANG(x_ang(j)/180*PI)
PRINT x_ang(j), ", ", dis_f(j)
NEXT j
! Plot results to the screen using PLOT keywords
title$ = "Checking focal length"
xtitle$ = "Object Space Angle (theta)"
ytitle$ = "Yref / TAN(theta) = focal length"
x_chk = 0.0005
y_chk = 0.0005
x_tick = 0.1
y_tick = 0.01
x_form$ = "%4.2f"
y_form$ = "%4.4f"
PLOT NEW # Initialize a new plot
PLOT RANGEY, 99.24, 99.34
PLOT TITLE, title$ # Place the title on the plot
PLOT TITLEX, xtitle$ # Place the x-axis title on the plot
PLOT TITLEY, ytitle$ # Place the y-axis title on the plot
PLOT CHECK, x_chk, y_chk # Define the plot symbol sizes
PLOT TICK, x_tick, y_tick # Define the distance between the x- and y-tick marks
PLOT FORMATX, x_form$ # Define the formatting for the x- and y-axis numbers
PLOT FORMATY, y_form$
PLOT DATA, x_ang, dis_f, 400, 1, 1, 1 # using all of the points in the array, using pen color 1 (blue), making the curve dashed type 1, and plotting both a line and symbols 1
PLOT GO # Generate the plot
! Release memory associated with array variables
RELEASE x_ang
RELEASE dis_f
! End program
PRINT "End of program."
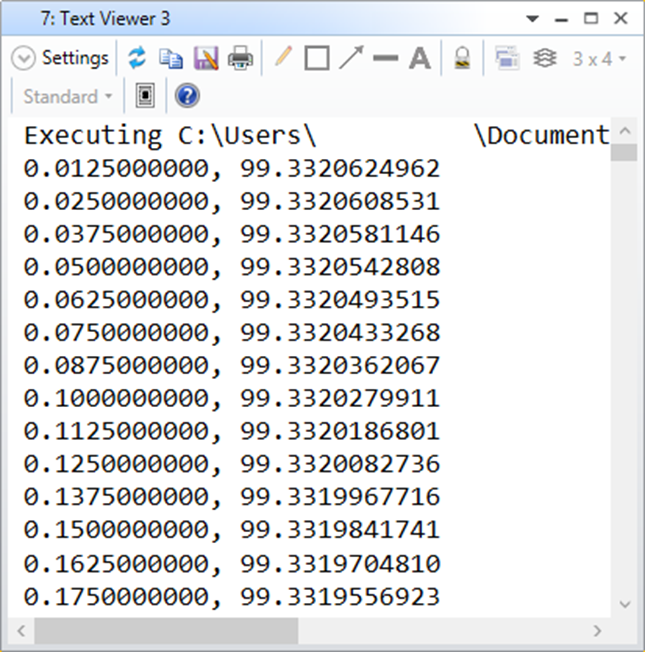
然後再到Programming Ribbon > Macro List中選擇剛剛存檔的Macro名稱執行,你應該看到如下結果。
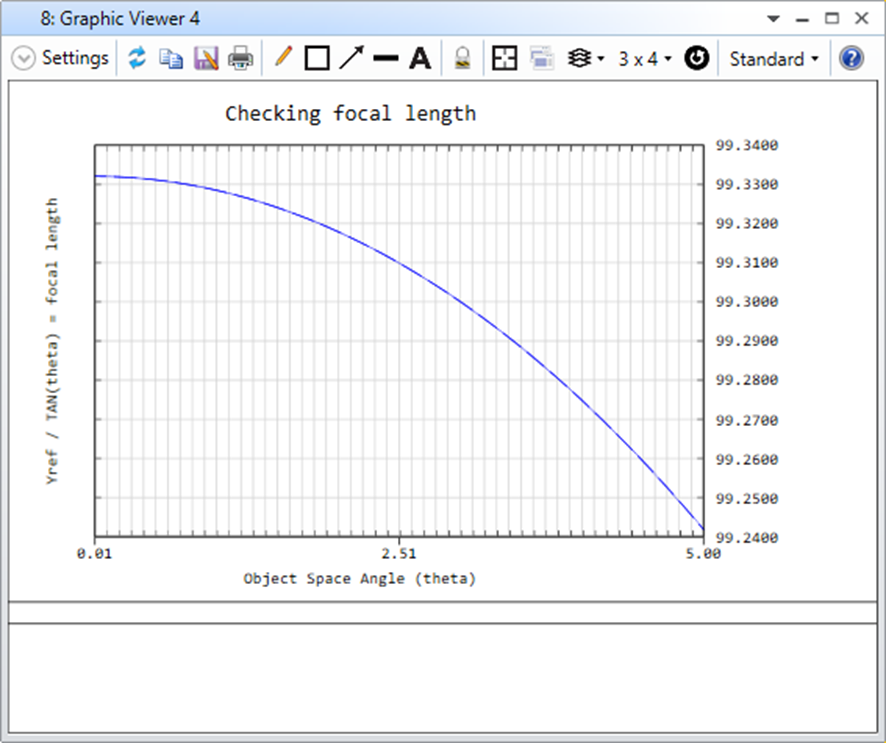
解讀:
此Macro使用迴圈掃描5度以內視場對應到的Yref/TAN(theta)計算結果。
文字視窗中顯示了原始資料點。可以看到0.05度之前,資料都跟系統計算的相同。
從圖表中可以看到,如我們所預期的,隨著腳度逼近零,計算結果會逼近一個常數。


