Legend problem-macro plots

  • 2 July 2020
  • 1 reply
  • 105 views

Dear Zemax team,


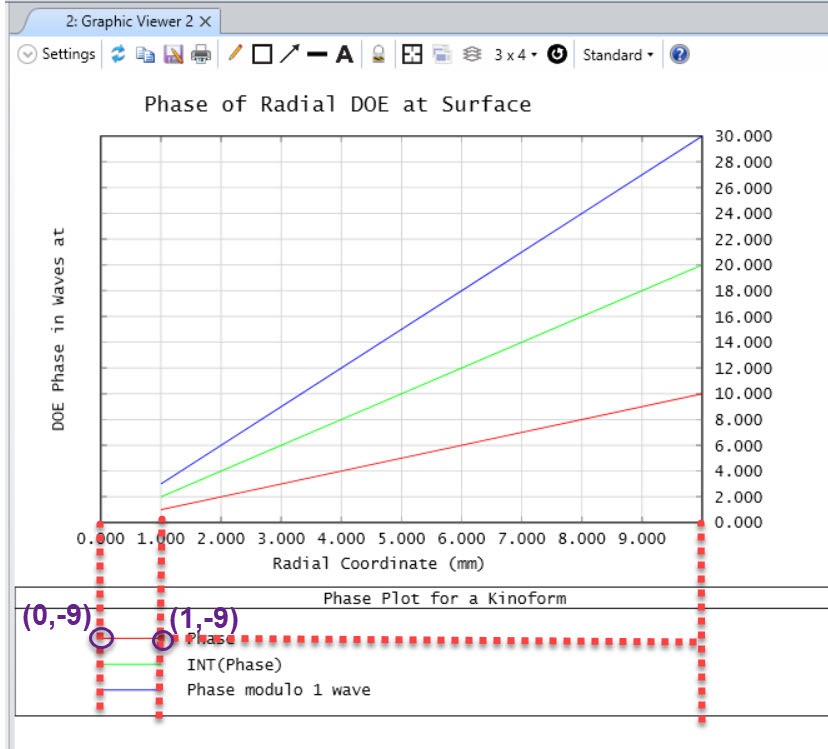
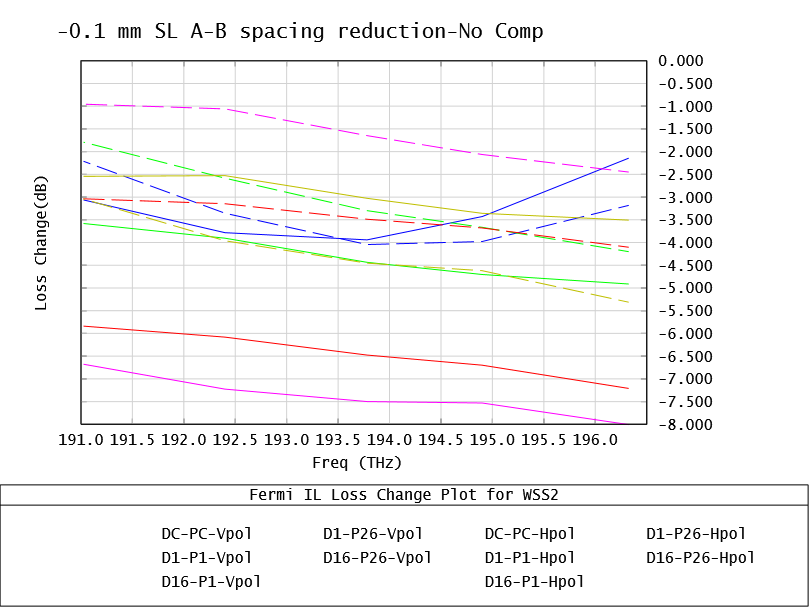
 Could you please help me put the legends showing the color of each line right next to the regarding legend or is there a way to do this with labels? As you can see, the labels do not show the colored line near them. So, it is hard to distinguish which one belongs to which data line. Next graph below is from an article on your webpage about diffractive optics macro and it does not have this problem. Attached in my macro. At the end of my macro , you can see how I call all the plots in a SUB routine. Your urgent help on this would be appreciated!


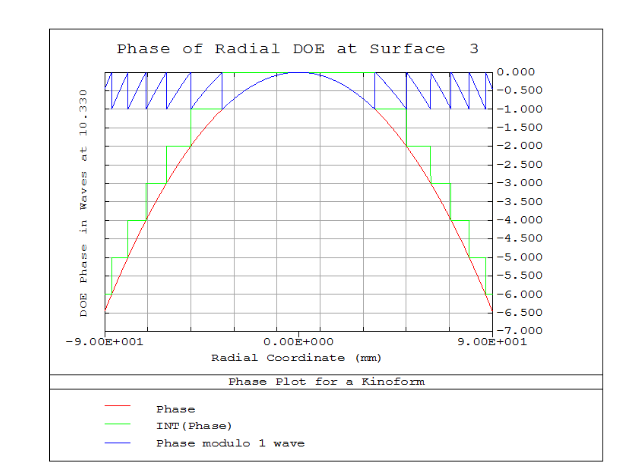
No problem with legends or labels in the knowledge base article plot about diffractive optics below;


1 reply

Userlevel 6
Badge +2

Hi Aytek!


I had to investigate a bit because I actually had never done it.


The legends lines are actually not an option but rather lines that are added to the plot:


plot data, line_pltx, line_plty1,2,3,0,0

plot data, line_pltx, line_plty2,2,2,0,0

plot data, line_pltx, line_plty3,2,1,0,0

line_pltx, line_plty1, line_plty2 and line_plty3 are vectors that contain two elements.


The software is going to trace them on the plot even if they are not within the x and y scales!


I have added a macro to demonstrate.


Let me know if that helps.


Sandrine


Reply