I am a student in internship and I need to use ZPL to automate my system. I have a system with LED, which I am optimizing. After this optimization I have to measure the power received on the detector for different Z positions (34 positions).
I do not know how to make a list of my different Z positions, how to change the value of the Z position for my detector and how to retrieve the value of the power received on my detector.
Thank you in advance,
Léo
Best answer by David.Nguyen
Hi Léo,
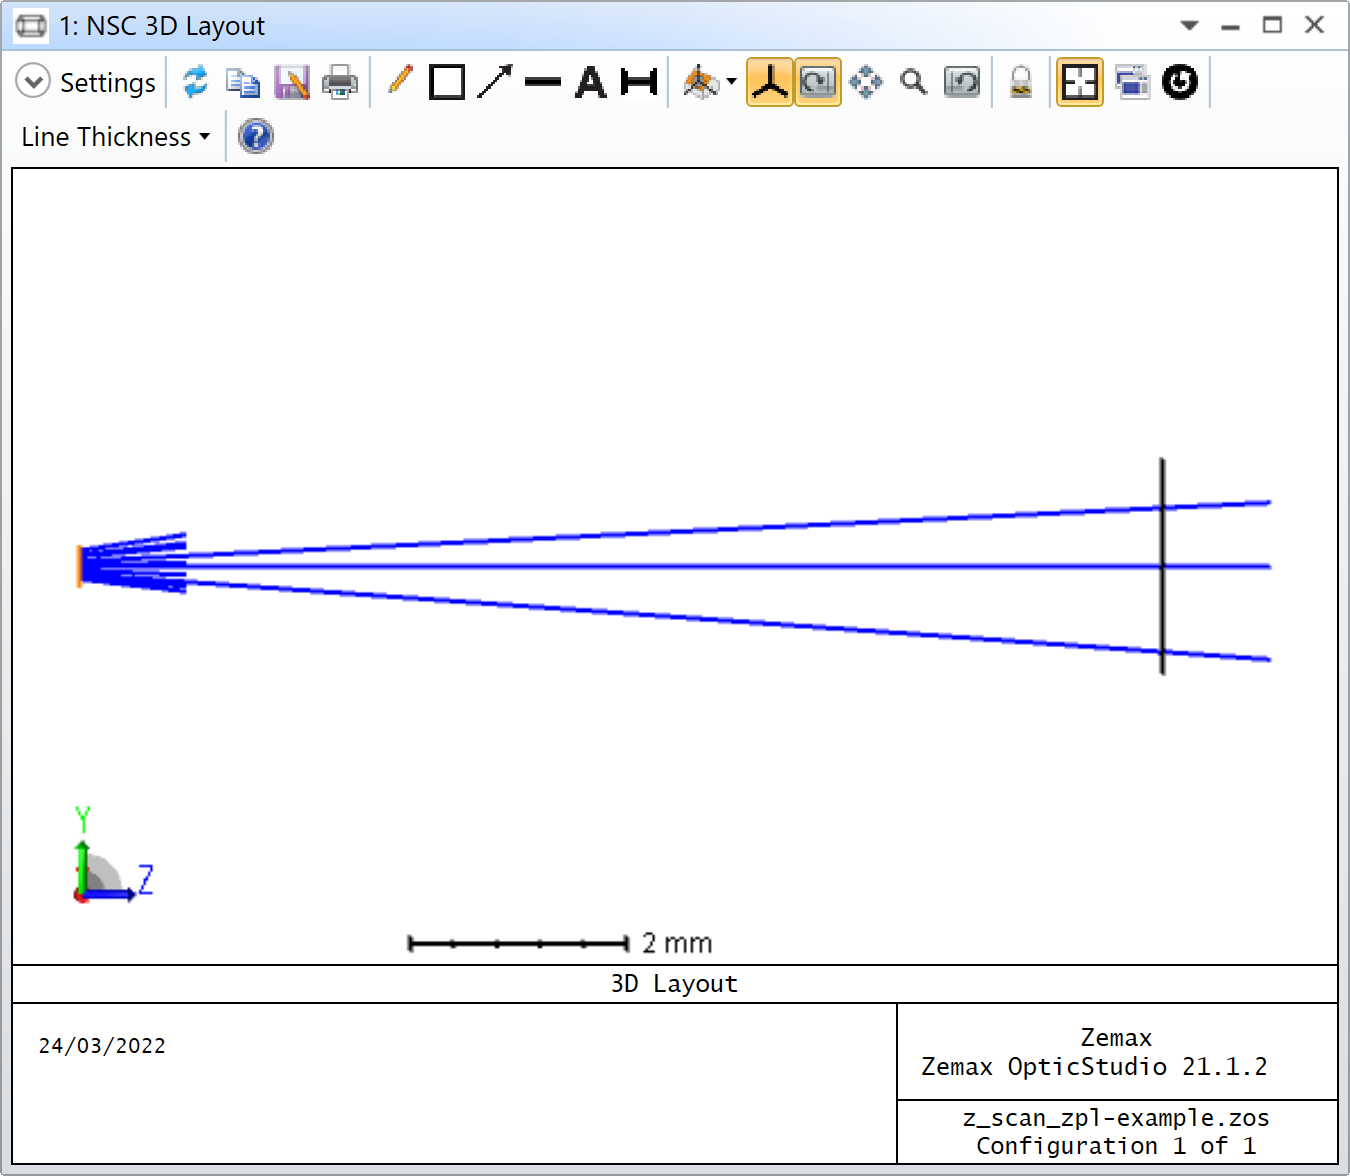
In ZPL, the Z Position of a non-sequential object can be modified with the SETNSCPOSITION keyword. Reading the power requires you to clear the detectors with the numeric function NSDD, run a raytrace with NSTR, and retrieve the power with NSDD again. You can create a loop to iterate through various Z Position with the keywords FOR, NEXT. I have made a dummy example for you (attached to this post).
The system is a divergent Source Ellipse followed by a Detector Rectangle.
The macro is as follow:
# Detector number detector = 2
# Minimum Z position z_min = 5.0
# Maximum Z position z_max = 10.0
# Z range z_range = z_max - z_min
# Number of samples samples = 10
# Z step size z_step = z_range / ( samples - 1 )
# Z position array DECLARE z_position, DOUBLE, 1, samples
# Total flux array DECLARE flux, DOUBLE, 1, samples
# Loop over the different Z positions FOR z_indx, 0, samples-1, 1 # Calculate new Z position z_pos = z_indx * z_step + z_min z_position(z_indx+1) = z_pos
# Update detector Z position SETNSCPOSITION 1, detector, 3, z_pos
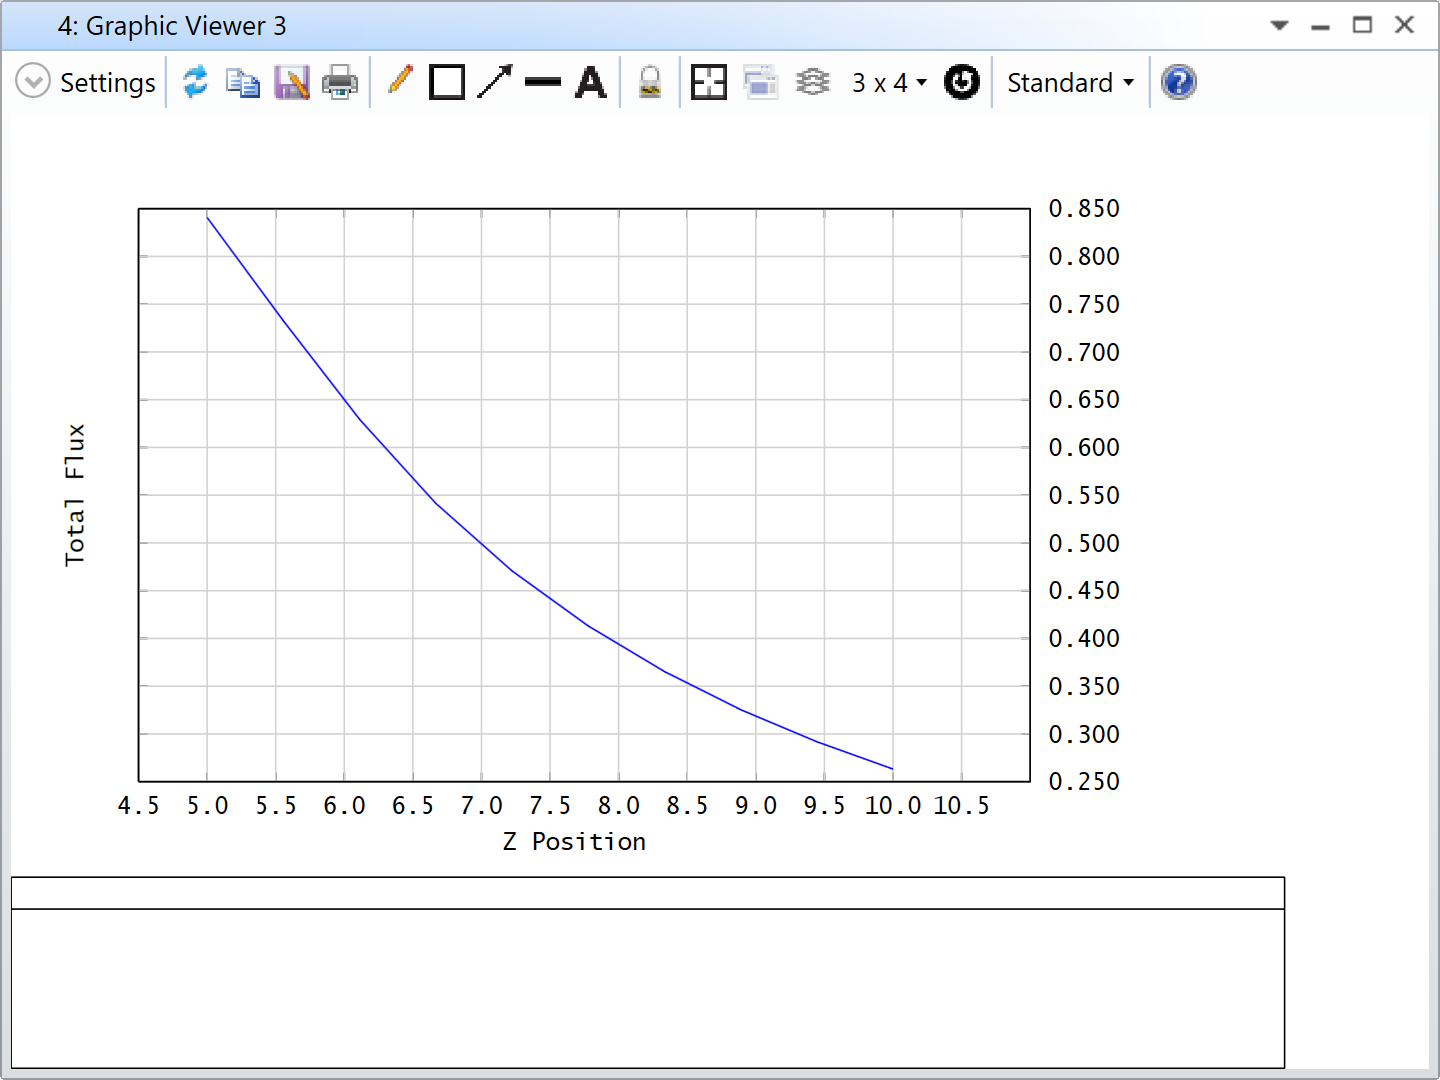
With my comments and the Help File (F1), I hope you’ll be able to make sense of it. You don’t need to plot the data, but I thought I might as well show you.
Let me know if you have questions about the code and take care,
If you want to stick with OpticStudio only. The NSDD operand can retrieve a single pixel value. Then, you should loop over the number of pixels to retrieve all the pixel values. But, I personnally don’t find this approach elegant.
The other solution I would rather opt for is to parse the saved text-file with Python/MATLAB. In this way, it is rather easy to remove the header of the text file, if that’s your problem, for example.
Can you let us know what you intend to do with those pixel values and I can try to come up with a more specific answer?
Thanks for the help. I am able to use GETTEXTFILE to save the detectors text file. But I only want to save the pixel values not the whole text file. How do I do that?
You probably figured it out already, but for everyone’s refernce, to change the X Position, you can keep using SETNSCPOSITION. However, this time, you would use 1 as the third parameter (1: X Position, 2: Y Position, 3: Z Position, 4: X Tilt, 5: Y Tilt, 6 Z Tilt).
As for the detector image data, it really depends what you want to save. Since I’m not sure what you mean by
all detector data
I will assume that you are referring to all the pixel values of your detector (basically, an image). There are two common ways to go about this.
The easiest way is perhaps to use the SAVEDETECTOR keyword:
The first parameter is the surface number for hybrid systems, for pure non-sequential systems, just use 1. Then, the second parameter is your detector number, and finally, the last parameter is a file name with or without a path (without path means the file is saved where the lens file is). Please note the following from the Help File (F1):
The extension should be DDR, DDC, DDP, or DDV for Detector Rectangle, Color, Polar, and Volume objects, respectively
Later, you can use the keyword LOADDETECTOR for display.
Alternatively, you can use the GETTEXTFILE keyword:
GETTEXTFILE <full_path>, DVR
In this case, you need to specify the full path to a text file. This keyword will not use a specific detector, instead it will use the default detector settings (if you want to modify the detector settings, have a look at this thread). The advantage of this technique is that you have the data in a text format that is easily parsed with MATLAB or Python for further analysis.
I tried to do something similar. I want to change the x position with ZPL, and I want to save the detector image data for each time x position is changed. How do i modified your code to save the all detector data?
In case the list is completely irregular, I would create an array beforehand and retrieve the Z positions from that array, in the loop. Something like:
In ZPL, the Z Position of a non-sequential object can be modified with the SETNSCPOSITION keyword. Reading the power requires you to clear the detectors with the numeric function NSDD, run a raytrace with NSTR, and retrieve the power with NSDD again. You can create a loop to iterate through various Z Position with the keywords FOR, NEXT. I have made a dummy example for you (attached to this post).
The system is a divergent Source Ellipse followed by a Detector Rectangle.
The macro is as follow:
# Detector number detector = 2
# Minimum Z position z_min = 5.0
# Maximum Z position z_max = 10.0
# Z range z_range = z_max - z_min
# Number of samples samples = 10
# Z step size z_step = z_range / ( samples - 1 )
# Z position array DECLARE z_position, DOUBLE, 1, samples
# Total flux array DECLARE flux, DOUBLE, 1, samples
# Loop over the different Z positions FOR z_indx, 0, samples-1, 1 # Calculate new Z position z_pos = z_indx * z_step + z_min z_position(z_indx+1) = z_pos
# Update detector Z position SETNSCPOSITION 1, detector, 3, z_pos
With my comments and the Help File (F1), I hope you’ll be able to make sense of it. You don’t need to plot the data, but I thought I might as well show you.
Let me know if you have questions about the code and take care,
We use 3 different kinds of cookies. You can choose which cookies you want to accept. We need basic cookies to make this site work, therefore these are the minimum you can select. Learn more about our cookies.