When getting a text file with Zemax-generated data (e.g. a wavefront map) using a ZPL macro, one could specify certain settings such as sampling resolution. While OpticStudio User Manual gives these settings for wavefront map, surface sag, Huygens PSF, etc. in the MODIFYSETTINGS section, it does not have anything given for Interferograms.
If I have a multi-configuration file, how am I supposed to specify to obtain interferogram between, say, configuration 2 and 3? How should I specify the sampling resolution? Is there a way to specify these settings at all?
Best answer by David.Nguyen
Hi ISHFM,
If you didn’t find these settings in the MODIFYSETTINGS section, then they probably aren’t implement. In this case, you’d have to ask Zemax whether and when they plan to implement those settings. However, in ZOS-API, the Interferogram analysis is fully implemented: it has specific settings and returns a DataGrid (instead of a text file that you then have to parse).
There’s a bit of a learning curve to using the ZOS-API but in case you’r still interested, I wrote a small snipet for you in Python (and Pythonnet 2.5.2, do not use Pythonnet 3.0 yet):
import numpy as np import matplotlib.pyplot as plt
# Change the system configuration TheSystem.MCE.SetCurrentConfiguration(2)
# Open new Interferogram analysis Interferogram = TheSystem.Analyses.New_Interferogram()
# Change Interferogram settings # (not exhaustive, the list of settings available can be found in the ZOS-API syntax help file) InterferogramSettings.Field.SetFieldNumber(1) # Field InterferogramSettings.Sampling = ZOSAPI.Analysis.SampleSizes.S_128x128 # Sampling
# Apply settings and run analysis Interferogram.ApplyAndWaitForCompletion()
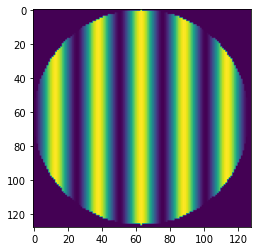
The “reshape” method should be in any template generated by OpticStudio from the Programming tab. You could change the configuration number in a For-loop and rerun your interferogram analysis everytime. This is the result that it gives me:
This is the full list of settings from the Syntax Help:
If you didn’t find these settings in the MODIFYSETTINGS section, then they probably aren’t implement. In this case, you’d have to ask Zemax whether and when they plan to implement those settings. However, in ZOS-API, the Interferogram analysis is fully implemented: it has specific settings and returns a DataGrid (instead of a text file that you then have to parse).
There’s a bit of a learning curve to using the ZOS-API but in case you’r still interested, I wrote a small snipet for you in Python (and Pythonnet 2.5.2, do not use Pythonnet 3.0 yet):
import numpy as np import matplotlib.pyplot as plt
# Change the system configuration TheSystem.MCE.SetCurrentConfiguration(2)
# Open new Interferogram analysis Interferogram = TheSystem.Analyses.New_Interferogram()
# Change Interferogram settings # (not exhaustive, the list of settings available can be found in the ZOS-API syntax help file) InterferogramSettings.Field.SetFieldNumber(1) # Field InterferogramSettings.Sampling = ZOSAPI.Analysis.SampleSizes.S_128x128 # Sampling
# Apply settings and run analysis Interferogram.ApplyAndWaitForCompletion()
The “reshape” method should be in any template generated by OpticStudio from the Programming tab. You could change the configuration number in a For-loop and rerun your interferogram analysis everytime. This is the result that it gives me:
This is the full list of settings from the Syntax Help: