API Settings - Transmission vs. Wavelength

  • 29 March 2021
  • 4 replies
  • 313 views

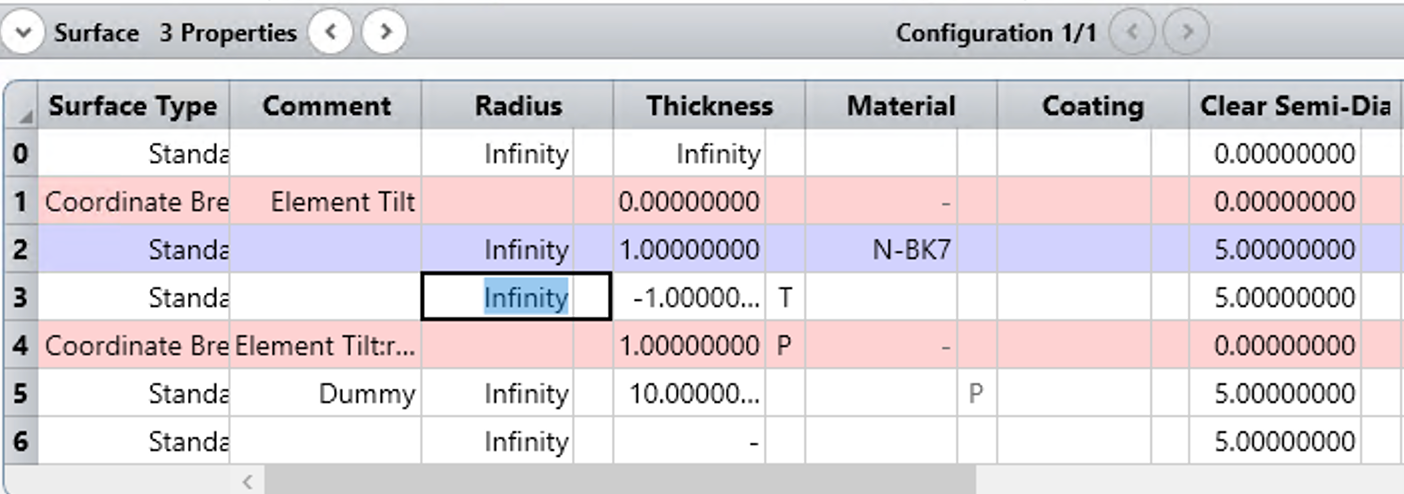
I'm trying to use the Matlab ZOS-API to define the settings (surface and minimum & maximum wave) of a coating transmission vs. wavelength analysis but I am not able to access them using GetSettings(). 


4 replies

Userlevel 5
Badge +2

Hi Xavier,


Thank you for contacting Zemax Support!


The analyses specific settings and the analysis specific results are not hooked up for the API for all the analysis types available in Zemax. The best method to review what is available and what is not available is to use the sample code provided in this knowledgebase article:


Generating a list of output data types for each analysis in the ZOS-API


If we run the script in MATLAB we see the following results for the analyses under Polarization and Surface Physics / Coatings:


210212-154736-image.png
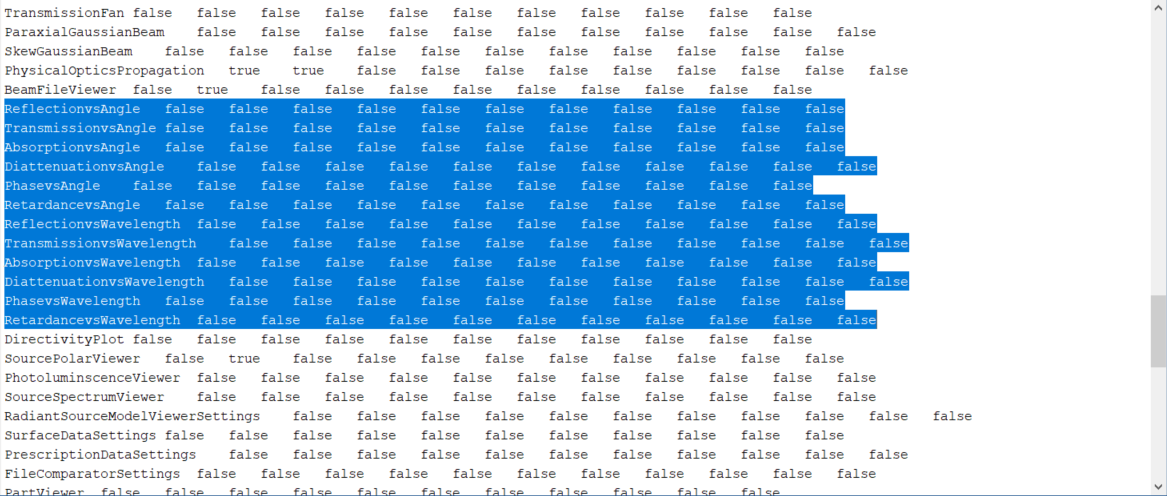
As all the fields are 'false' for these analyses, this means that no analysis specific settings are available and no Data Grids or Data Series are returned for these tools. That said, we still have options to run the analyses and pull the data, but it will require a bit more work.


You can run the following code from MATLAB to see the results:


TheSystem = TheApplication.PrimarySystem;newWin = TheSystem.Analyses.New_Analysis(ZOSAPI.Analysis.AnalysisIDM.TransmissionvsWavelength);% Check for analysis specific settings. If the following line returns false, we can use MODIFYSETTINGS to alter the settings: newWin.HasAnalysisSpecificSettings


The code returns 0, so there is no built-in settings from the API, in which case ModifySettings provides a possibility to adjust the settings as shown in Example 17 - Bulk Scatter. But if you check the Help file for the MODIFYSETTINGS keyword, which does the same kind of alterations from the ZPL macro, you can see that there is no codes for the Transmission Vs Wavelength analysis. You may find more info about this in the Help at:

The Programming Tab > About the ZPL > KEYWORDS (about the zpl) > MODIFYSETTINGS (keywords)


This means, that for this specific analysis we cannot use ModifySettings from the API either. This leaves us with one option, which is that we can save the different settings we would like to run to different configuration files manually from OpticStudio before running any API code, and then we just load the specific config files from the API. To load the desired config file you can run the following lines from MATLAB:


analysisSettings = newWin.GetSettings();cfgFile = ...;analysisSettings.LoadFrom(cfgFile);


Finally a note about retrieveing the results from the API. As from the attached image above we can see that there are no Data Grids or Data Series returned, i.e. all variables are false, we can only use the GetTextFile from the API to pull the results to a text file, and then we will need to read back that text file to MATLAB and process the data. You may find more information about how to use GetTextFile from the API in Example 10 - NSC ZRD filter strings. You may use the following lines to do this in MATLAB:


newWin.ApplyAndWaitForCompletion();new_Results = newWin.GetResults();new_Results.GetTextFile(System.String.Concat(TheApplication.SamplesDir, '\API\Matlab\transmissionVSwavelength.txt'))


To read back the results from the text file to MATLAB you can use fscan or a similar MATLAB command to pull the data into native variables in MATLAB. You can use the following forum post to get you started:

Extract Data from text File - MATLAB Answers - MATLAB Central (mathworks.com)


I hope this helps, but if you have further questions, please let me know and I will be happy to Help!


Best,


Csilla


Hello,

now, two years later, I have the same problem.

I want to use Analyses.New_Analysis(AnalysisIDM.ReflectionvsAngle), but not only on the first surface. So I have to change the analysis’ settings. According to Csilla’s post, there is no solution for doing that via ZOSAPI. At least this was the case two years ago.

Please, can somebody tell me whether this is still the current status?


Best regards,

René

Userlevel 6
Badge +2

Hi Rene,

No, you still can’t access the settings for ReflectionvsAngle (at least in 2022R2 and I haven’t seen any mention of this analysis in the subsequent release notes).

Luckily, almost all the analysis are easy to recreate with a little bit of programming.  For the ReflectionvsAngle, this is easy to achieve with just the Universal Plot (but you can automate with the API).  The only thing you need to do is prepare your LDE so you have a Coordinate Break pair around your surface under investigation:

Then you can use the CODA Merit Function Operand with Data = 1/-1 to calculate the S & P polarization for the chief ray.  Finally, rotate the first Coordinate Break from 0 to 90 (Tilt About X).

You can plot all three values (S, P and Average) via a Universal Plot and see that you get the same value as as the ReflectionvsAngle graph:


Hi Michael,

that sounds great, thank you very much for your fast reply!

My own workaround is very different: I create a new system and copy just the surface to be investigated to that dummy system. Wavelengths and adjacent materials are copied as well. Then I can use the analysis on that system.

But maybe I will try your solution as well. :)

Cheers, René

Reply