Question

Export Angle of Incidence for All Rays Hitting Detector in NSCE


Hello,

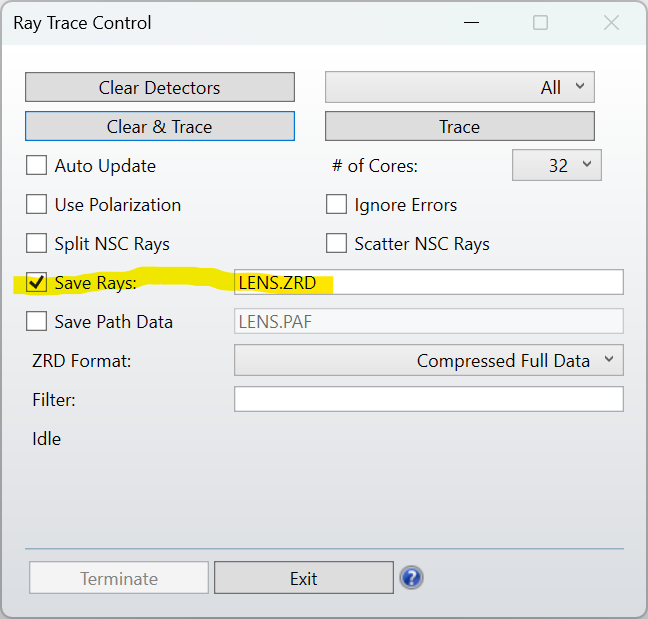
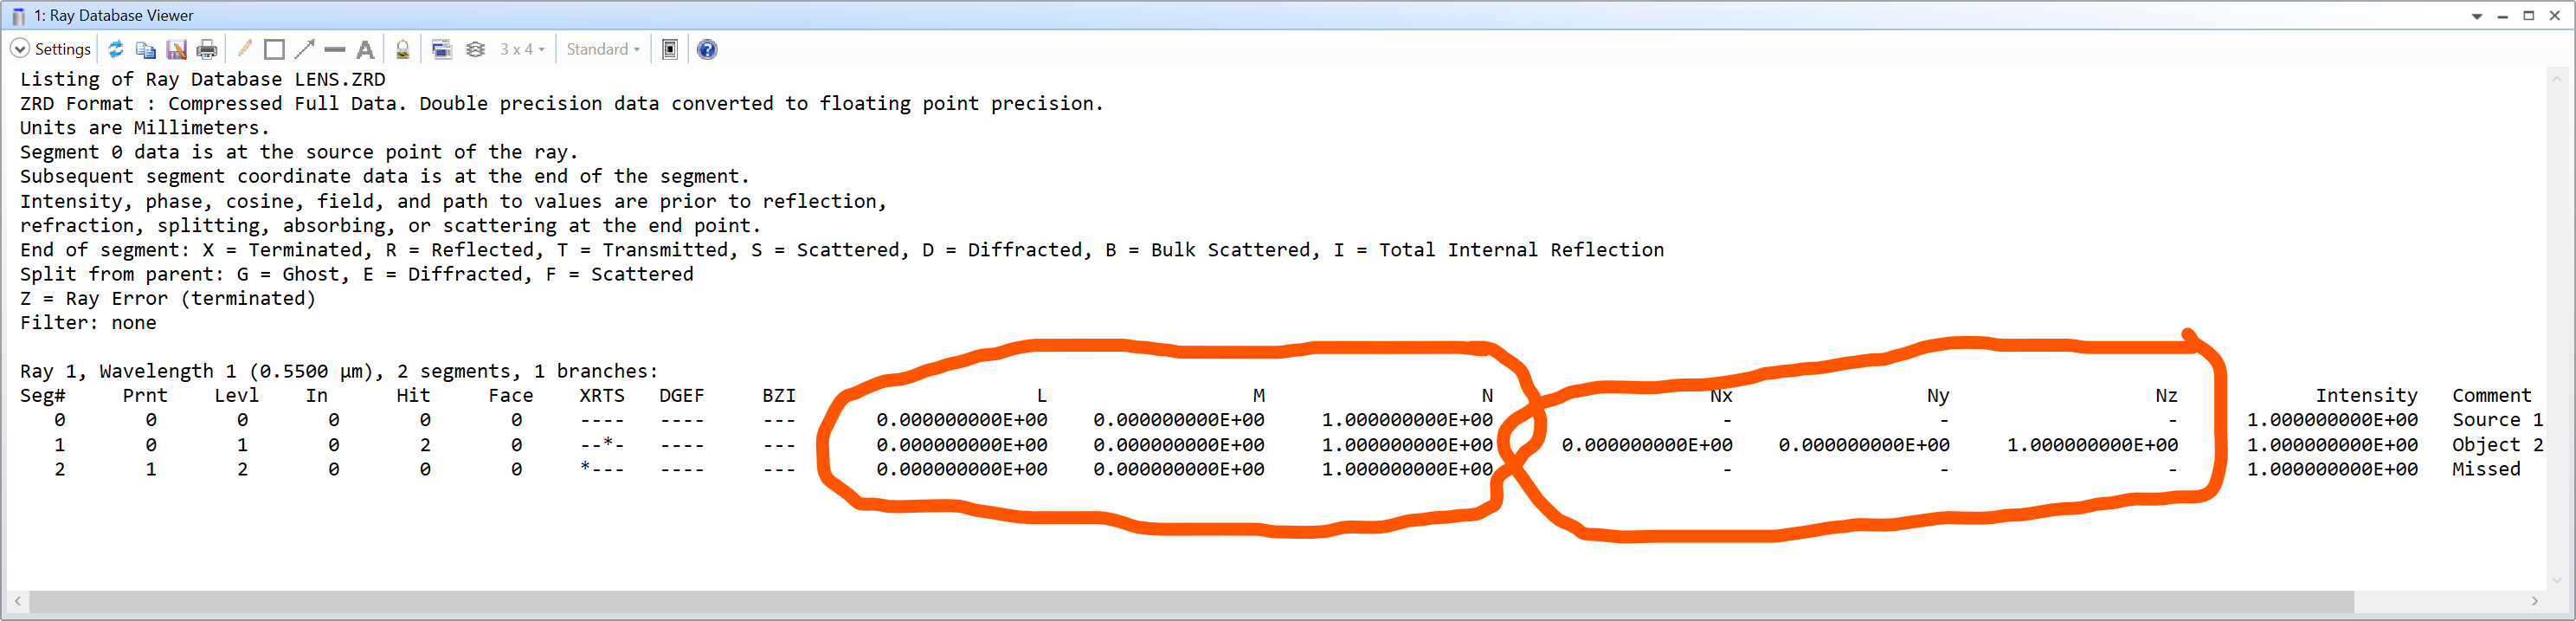
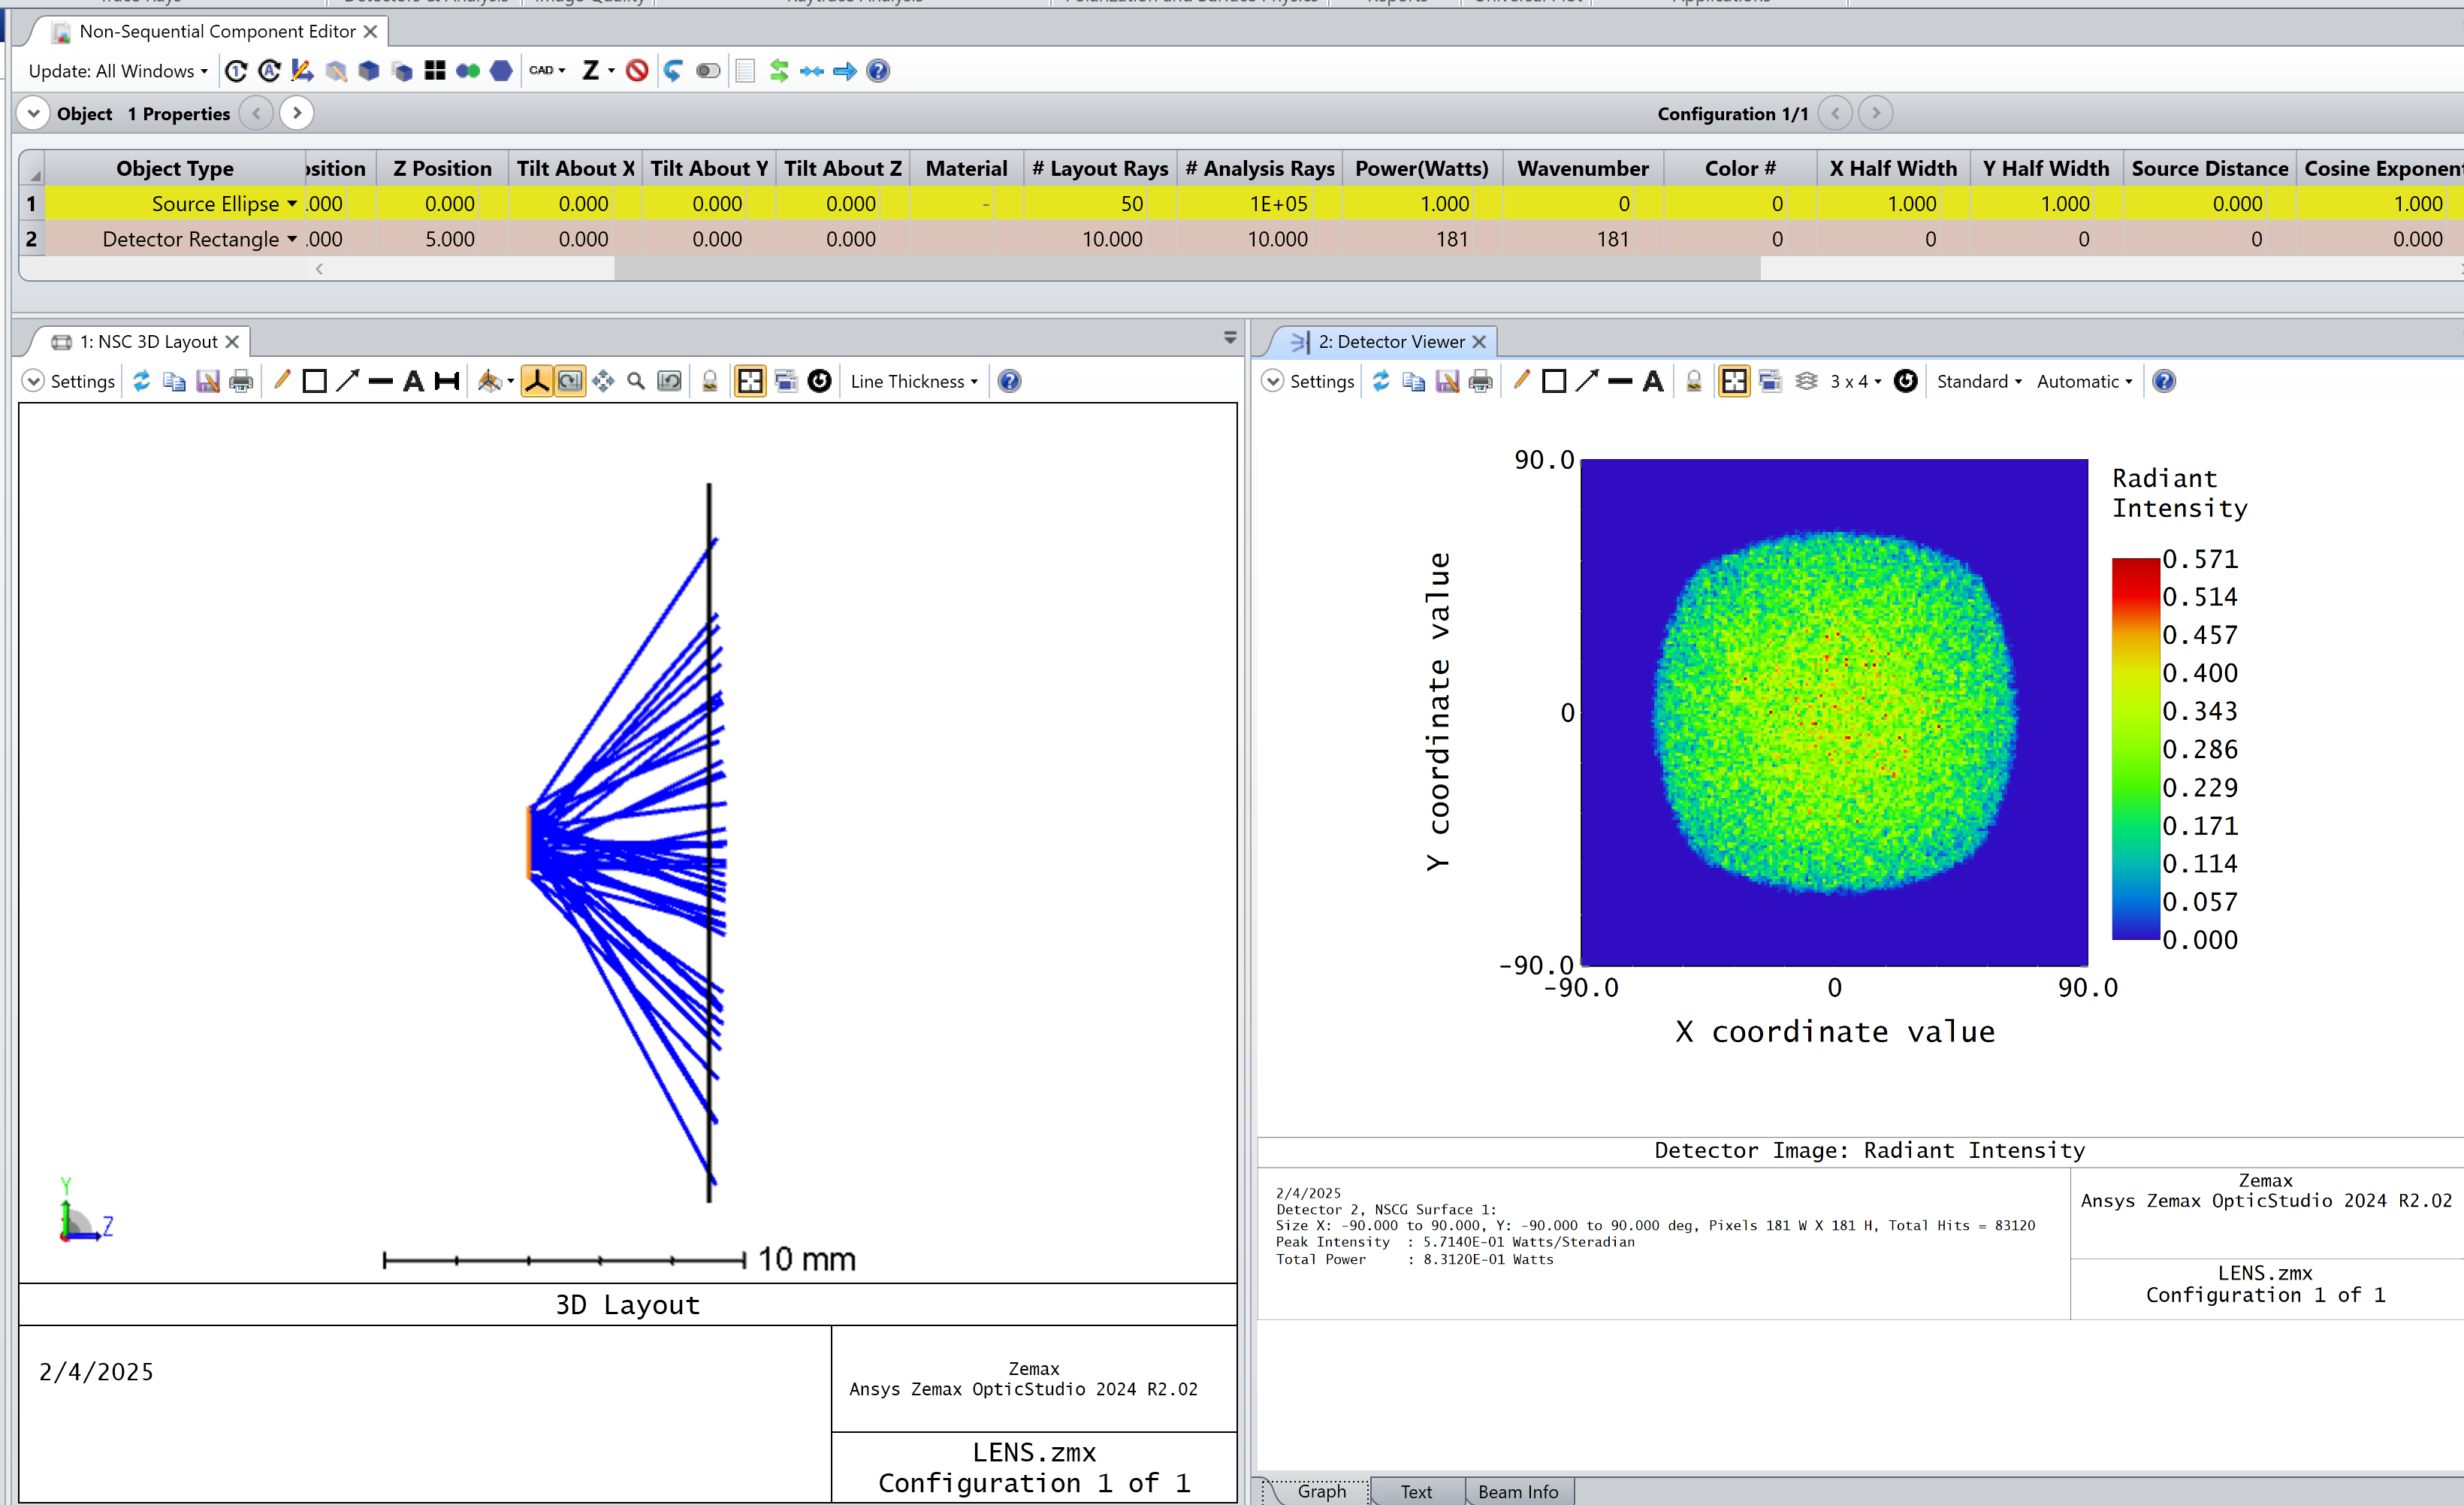
Could someone please show how to setup in Non-Sequential Mode a Detector and export the angle of incidence for all the light rays hitting the detector?

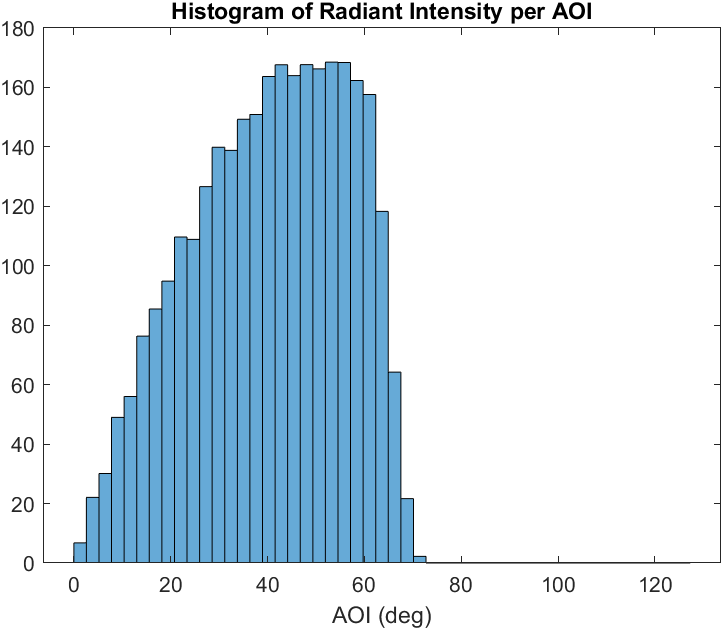
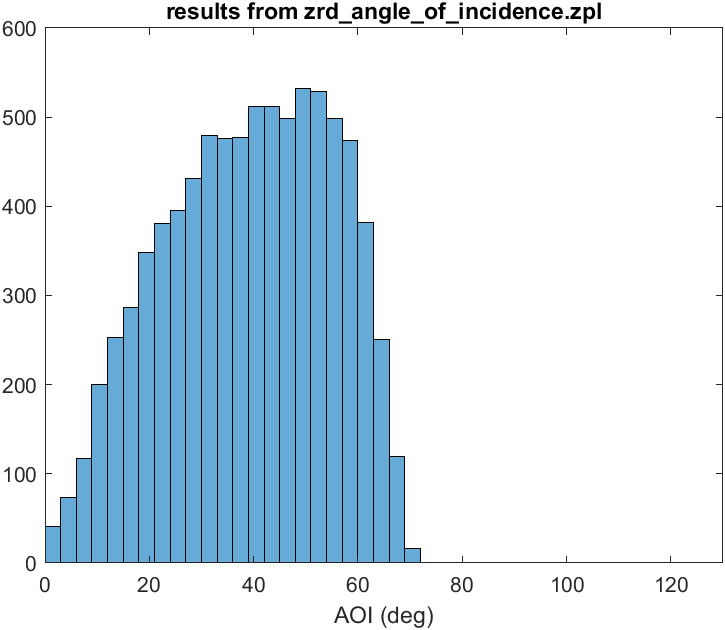
The goal for me is to import this distribution in matlab for plotting angle of incidence distribution/histogram and additional convolution with other curves to understand the properties of the light source as well as how it interacts with the detector.

4 replies

David.Nguyen
Luminary
Forum|alt.badge.img+2
  • Luminary
  • 1089 replies
  • February 4, 2025

@Andrey.Kuznetsov 


I think you should save the ray data when doing the raytrace, which will create a ray database (extension *.ZRD).

Then, in MATLAB, you should be able to parse this database and extract the ray segment direction (LMN) as well as the normal vector at the segment-object interface (Nx, Ny, Nz).

You can then use the scalar product to get the angle of incidence.

@Michael Cheng wrote a Python code to parse ZRD files, perhaps you can translate it into MATLAB (I don’t use MATLAB sorry 😔).

Also, ​@John.Hygelund did something similar in sequential mode with MATLAB here:

Perhaps it helps you.

Take care,


David


John.Hygelund
Fully Spectral
Forum|alt.badge.img+1
  • Fully Spectral
  • 71 replies
  • February 4, 2025

You can also copy radiant intensity of the ‘text’ tab of a detector. If you have the detector set to accept angles from -90 to 90 and have 181x181 pixels, each pixel is a  square degree


d; %= 181x 181 radiant intensity array copied from zemax

% Define the angles from -90 to 90 degrees
angles = linspace(-90, 90, 181);

% Calculate the sum root square of x and y angles
[angles_x, angles_y] = meshgrid(angles, angles);
sum_root_square_angles = sqrt(angles_x.^2 + angles_y.^2);

% Flatten the arrays for histogram plotting
energy_flat = d(:);
sum_root_square_angles_flat = sum_root_square_angles(:);

% Create a 1D histogram of energy per angle
histogram('BinEdges', linspace(0, max(sum_root_square_angles_flat), 50), ...
          'BinCounts', accumarray(discretize(sum_root_square_angles_flat, linspace(0, max(sum_root_square_angles_flat), 50)), energy_flat, [], @sum));
xlabel('AOI (deg)');
title('Histogram of Radiant Intensity per AOI');

matlab code above with a little help from copilot 


@John.Hygelund the issue is that my source is not a point source, but the output of an integrating sphere with 24mm aperture, while detector is 10x10mm. So I don’t think your source ellipse method with pixels will work.

In addition to David’s link, I also saw this thread: 


Will attempt to try it out the Ray DB.


John.Hygelund
Fully Spectral
Forum|alt.badge.img+1
  • Fully Spectral
  • 71 replies
  • February 5, 2025

Hi ​@Andrey.Kuznetsov ,

Thanks for the reply. I’m not understanding your limitation. The method above should be agnostic to the source.

Thanks for mentioning the other post. I checked and get the same results using the .zpl


Reply


Cookie policy

We use cookies to enhance and personalize your experience. If you accept you agree to our full cookie policy. Learn more about our cookies.

 
Cookie settings