

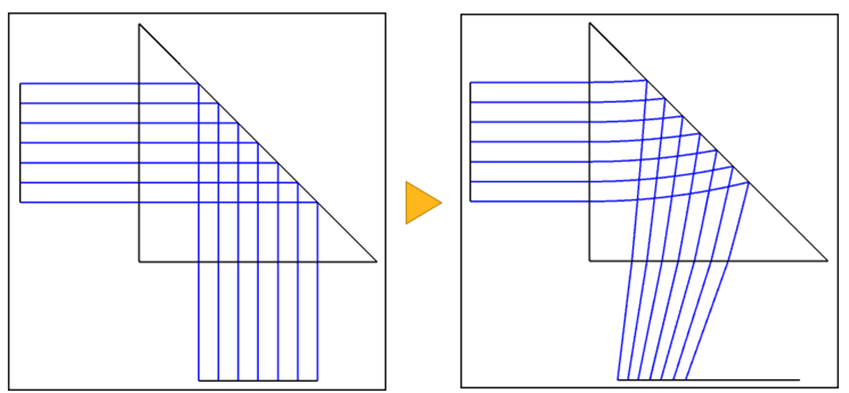
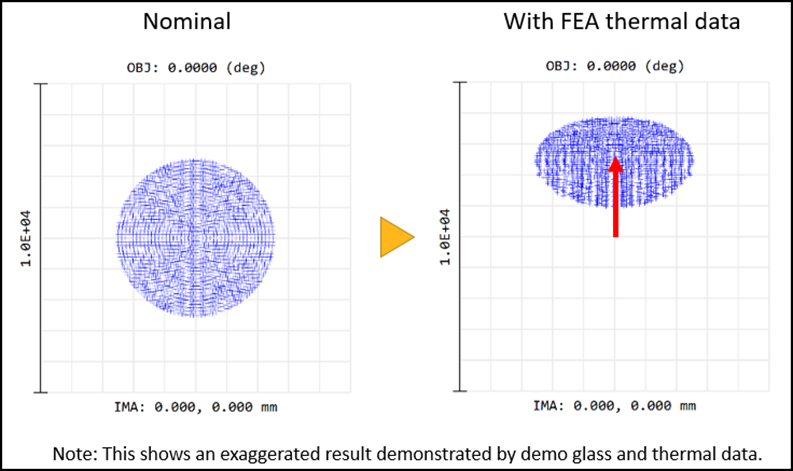
Gradient optical effects of temperature distribution on a prism that reflects light inside the prism can be important , as shown in the figure below . I will introduce how to define the prism by OpticStudio sequential mode, and how to use the STAR tool for this purpose.
In OpticStudio there are several ways to define a prism that reflects light with total internal reflection (TIR) or metal mirror. To import temperature data with the STAR tool and perform a STOP analysis of the prism, some consideration was needed because there is a restriction on the surface types that temperature data can be applied to and requires a workaround. The detail of the restriction is described in the help file excerpt below.
Restrictions on surfaces following thermal data
Not all surface types are allowed to follow a surface with thermal data applied. For further details see the discussion in Gradient 1 'Restrictions on surfaces following GRIN surfaces'.
The currently supported surface types are:
- Even Asphere
- Extended Polynomial
- Grid Sag
- Irregular
- Odd Asphere
- Off-Axis Conic Freeform
- Q-Type Freeform
- Standard
- Tilted
- Toroidal
- TrueFreeForm
- User Defined
- Extended Asphere (support added in Ansys OpticStudio 23R2)
- Extended Odd Asphere (support added in Ansys OpticStudio 23R2)
- Q-Type Asphere (support added in Ansys OpticStudio 23R2)
- Zernike Fringe Sag (support added in Ansys OpticStudio 23R2)
- Zernike Standard Sag (support added in Ansys OpticStudio 23R2)
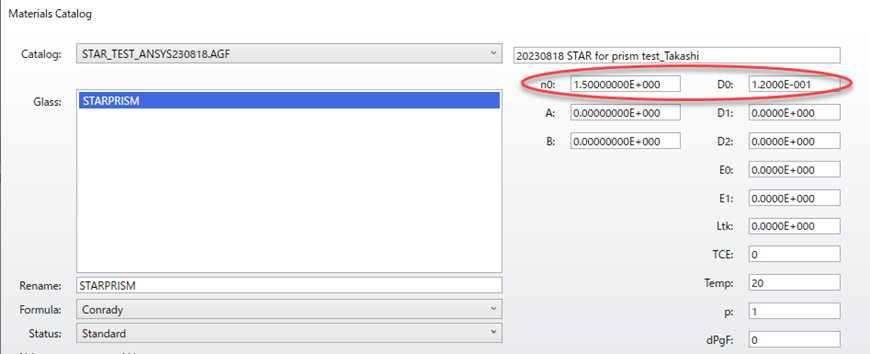
The Lens Data Editor of the prism for STOP analysis is shown below. The attached sample file contains virtual glass data (STARPRISM) that has a characteristic of significant changes in refractive index due to temperature. Although it is not a realistic glass, this property emphasizes the change of ray path due to temperature distribution and is useful for demonstrating the effect that can be simulated with this workflow.
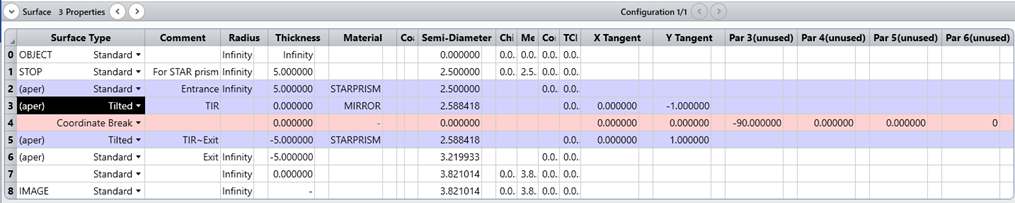
As you can see, the Tilted surface is used twice. The first Tilted surface is set to be a reflective surface and is then followed by a Coordinate Break to change the local axis of the next surface. The Thickness of the Coordinate Break is set to zero. Set the second Tilted to be the same as the reflective surface and set the material to be the example prism glass that is used for this example.
Also, the sample's temperature data was created so it increases linearly along Y-axis of the entrance plane. This temperature data is ideally created using MATLAB.
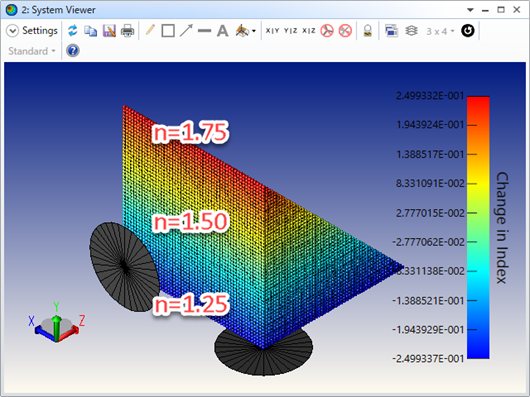
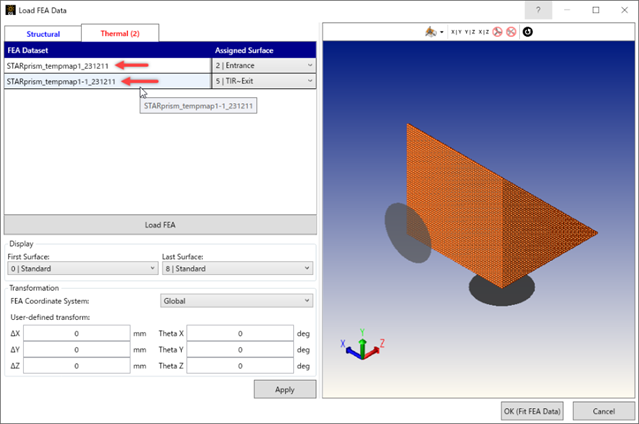
Two copies of the temperature data are used, one for the path from the entrance surface to the reflective surface and one for the path from the reflective surface to the exit surface. The same FEA data can be used if it is output from FEA tool based on the same global coordinate as OpticStudio.
Note: The Multiphysics Data Loader features logic that prevents the same dataset from being loaded to multiple optical surfaces. Therefore, you need to copy and rename a new FEA dataset to load the data into the two paths.
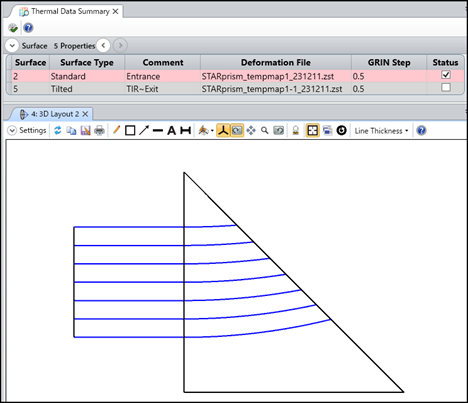
The image below is a 3D Layout that depicts the first path from the entrance surface to the reflective surface. Because the refractive index changes vertically, the direction in which light rays go up.
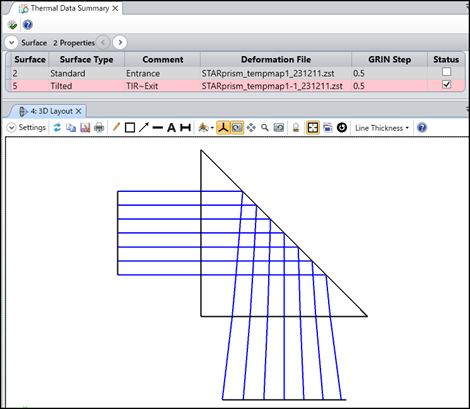
The image below is a 3D Layout of the second path that considers only the reflection surface and the exit surface. This situation is physically impossible since this ignores the temperature of the first path. OpticStudio refers to the refractive index of the input and output sides to calculate the output ray angle, so parallel rays have changed to diverging rays.
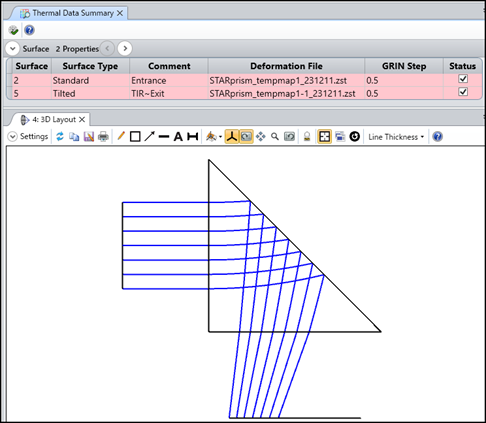
Enabling both temperature data correctly traces as rays propagate inside a prism with a refractive index gradient.
Depending on the way you define the prism in your system, STOP analysis of optical systems using reflection prisms is possible. It is useful for optical systems in many applications, such as prisms for optical communications and total internal reflection (TIR) prisms for DLP projectors.