

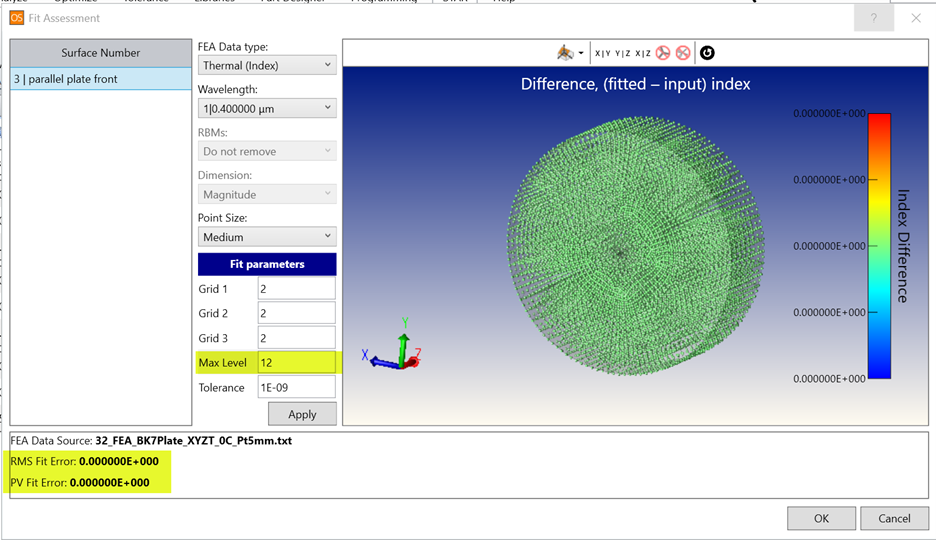
If you are using the STAR Fit Assessment and trying out different input parameters, you might notice that it’s possible to drive the fit error to zero. In the example below, I’ve taken a set of FEA temperature data and set the Max Level to 12 so that the fit algorithm runs more iterations and the fit errors are driven to zero. This indicates that the fitted points exactly fit the input points at each XYZ point in the FEA data.
However, this plot doesn’t tell us what’s happening *between* the FEA mesh points. In fact, while the fit at the individual points is better, the fit between the points is worse.
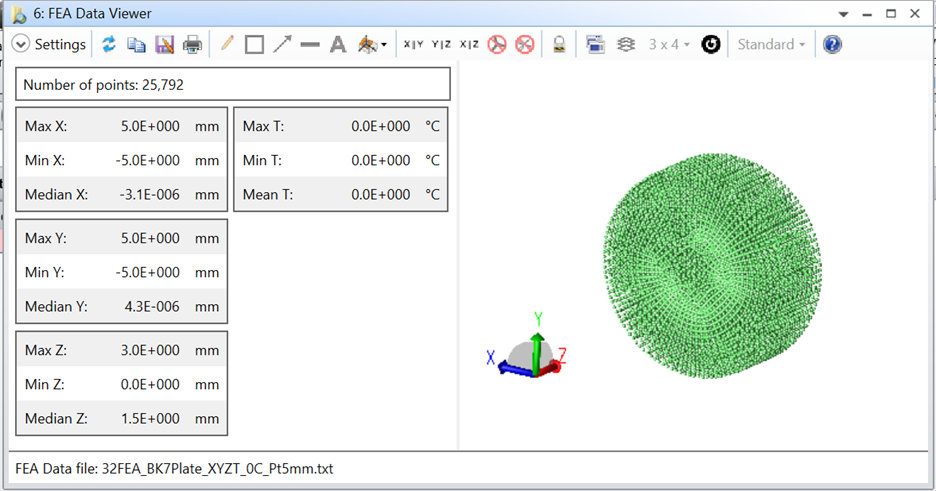
In the following example, the (artificial) FEA data set defines the temperature of a plate as a constant 0° C. Ideally, the wavefront should be zero and the spot diagram infinitely small after applying the FEA data. But the numeric fit won’t be perfect everywhere, and the total number of data points is relatively low at 25,000, as you can see below in the FEA Data Viewer.
If I fit this constant temperature data with Max Level parameters of 5 and 8, the Fit Assessment looks better for a Max Level of 8.
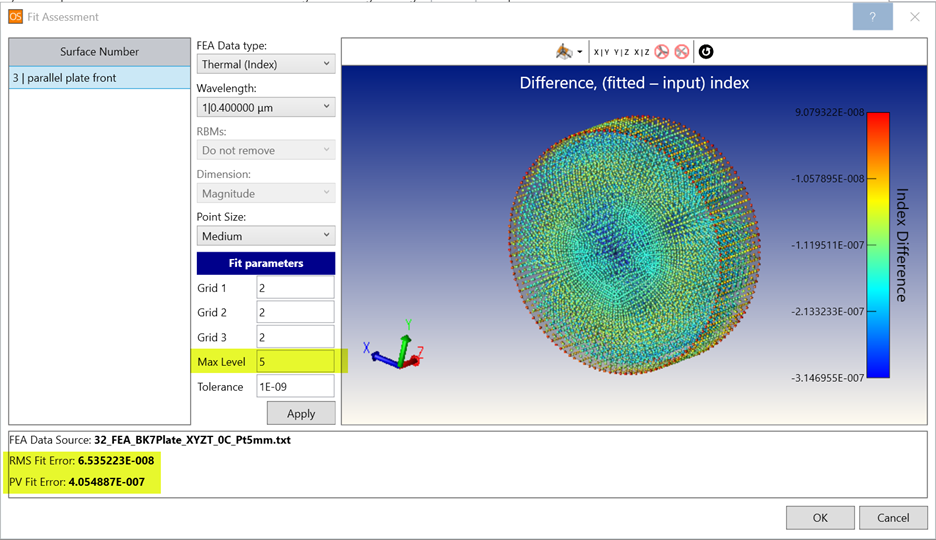
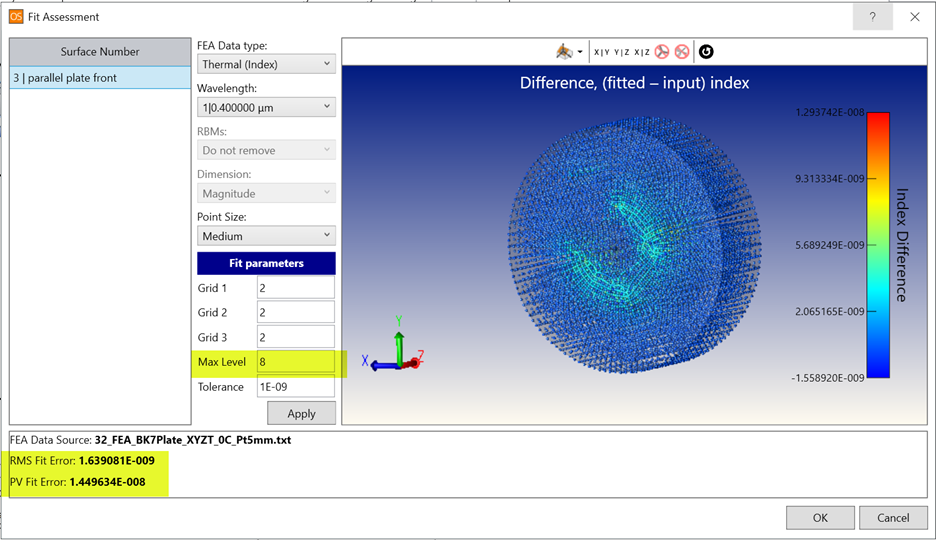
But the Fit Assessment only shows what’s happening exactly at the FEA mesh points. If I look at the wavefront maps, instead, I can see that at a Max Level of 8, the wavefront contains features with higher spatial frequency. The fit is so tight about the individual FEA mesh points that it introduces slope errors between the points. We call this effect print-through, meaning the FEA mesh prints through into the final fit.
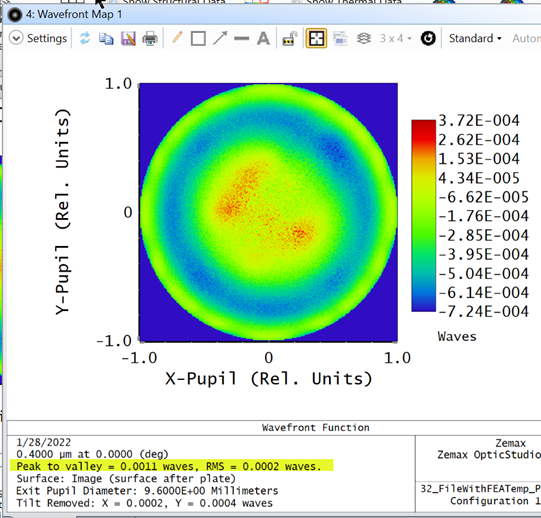
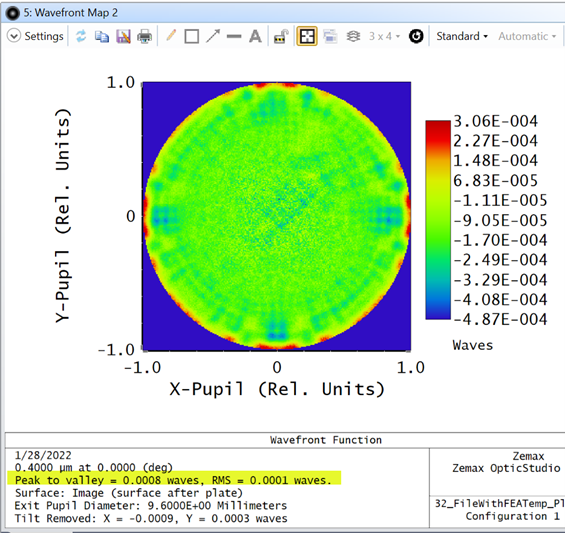
The print-through shown here is less than 1/1000 waves peak-to-valley. This small effect can only be seen in this artificial case because the expected wavefront is zero. For a realistic system and real FEA data, residual wavefront error will hide this kind of smaller print-through effect. Similarly, in the surface sag maps, the sag of the mirror or the sag due to the deformations will hide the print-through effects.
We are working on tools that will allow users to evaluate the print-through directly. At the moment, users will have to read out the sag maps for further analysis. (We will provide an API example of this soon.)