The reason POP and geometrical methods give different results

  • 14 May 2019
  • 5 replies
  • 347 views

Userlevel 6
Badge +2

There are actually several possible answers depending on your files.


Some are because of misunderstanding to the POP result (mostly about the coordiante). Some are really diffraction effects and that can only show in POP and that's why you should use POP.


If it's complicated, you may still need to go support, but let's share experience here to help POP users!  Hopefully, we can conver some most common questions here.


I will start by one or two below.


5 replies

Userlevel 6
Badge +2
Attached file shows a common case.

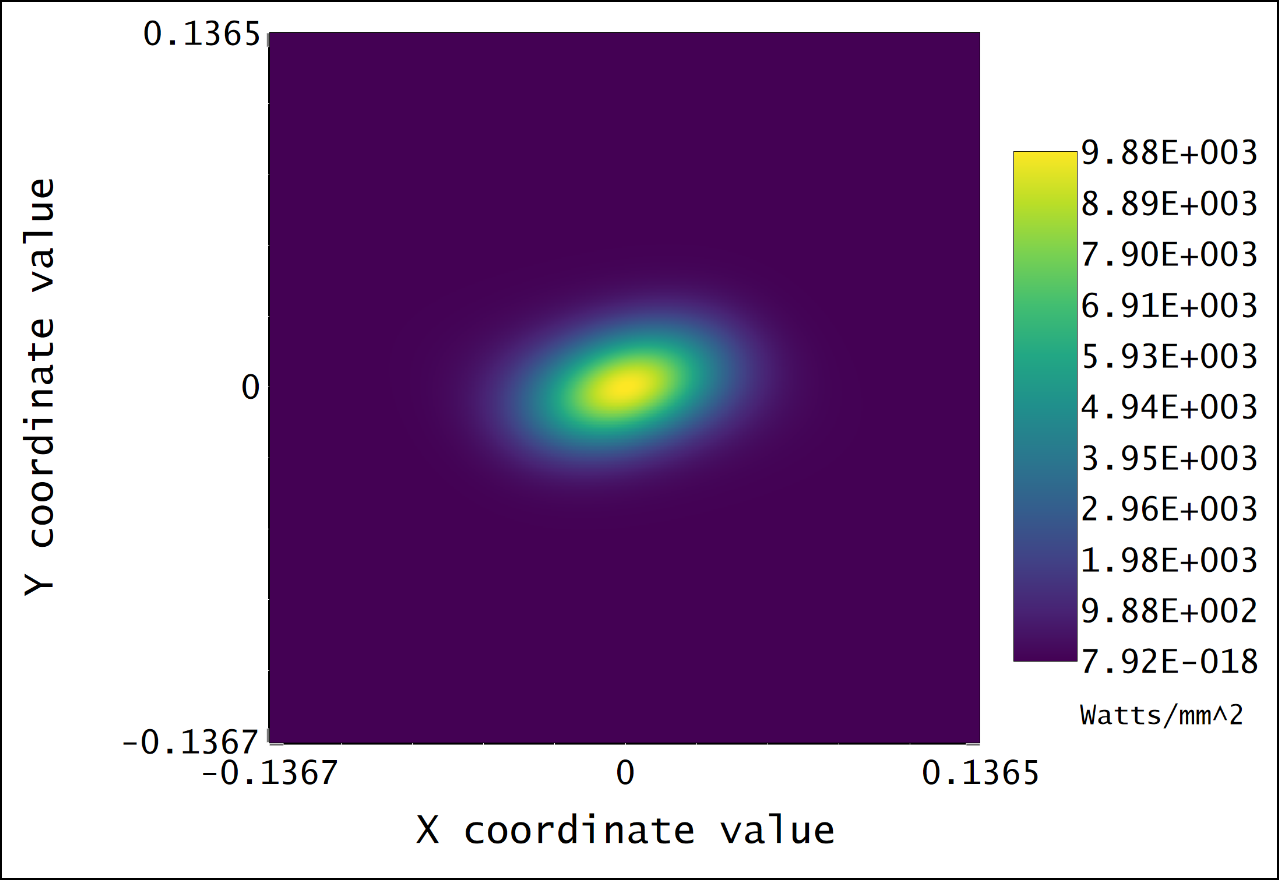
In this file, a Spot Diagram and a POP windows are opened. As you can see the beam is oriented in different directions. However, you will agree they are actually supposed to be same if you carefully check the settings.


The answer is that the XY axes in the POP windows and Spot Diagram are different.

In Spot Diagram, the XY axes simply follows the image surface's local coordinate.

In POP, on the other hand, the beam profile is rotated by an angle. This angle reported in the "Prop Report", which can be found at the bottom of the POP window.  If we check it, we can see it's represented by a rotation matrix as below.

0.707106781 0.707106781 0.000000000

-0.707106781 0.707106781 0.000000000

0.000000000 -0.000000000 1.000000000


If we follow the knowledge base article below, we can convert the rotation matrix to Tilt X/Y/Z.

Rotation Matrix and Tilt About X/Y/Z in OpticStudio

The results are:

Tilt About X = 0 degree

Tilt About Y = 0 degree

Tilt About Z = -45 degrees.


If you check it again, you will find it's true it looks like the relationship of the spots in POP and Spot Diagram are a rotation of 45 degrees.


So why is this difference? It's understandable the Spot Diagram just follows the image surface's local axes.

For POP, we need to seek the answer in Help.

In the section "The Analyze Tab (sequential ui mode) > Laser and Fibers Group > Physical Optics Propagation", you can find part talking about "beam projection".  Here is a excerpt:
The analysis computes the beam irradiance or phase on a plane tangent to the chief ray at the point where the chief ray intercepts the surface.


For convenience, that's call this plane as "POP plane". From the description, it's important to note that the POP plane may not be only rotated along the local z-axis. This file only shows a simple condition. This is actually obvious if you consider that we represent the orientation of POP plane by a full rotation matrix, which can represent any orientation in 3D space. Also, the POP plane will not always be centered by the vertex of the surface. This will only be true when you have a symmetrical system and use central field for POP simulation.

This has a big benefit. That is, we can make sure the beam is at the center of the POP plane in most of the cases. Only when the beam is at the center of the POP plane, we are possible to use a small grid to sample it.

Hi Michael,

On this topic, I’m trying to model a non-rotationally symmetric system that has an astigmatic beam coming from the laser. We don’t know exactly the amount or orientation of the astigmatism, so I’m trying to model the potential effects on the final beam quality. To do this, I wanted to be able to iterate through several astigmatic conditions and then rotate this beam to see how orientation of the beam affects the beam ellipticity. Clearly a coordinate break in the beginning does not allow for this. Is there another way I can try to do this? Because the system and optics are non-rotationally symmetric, it’s not sufficient to only look at cases where the astigmatic axes align with “X” and “Y”.


A small example of this is with a biconic lens. The beam I’m using in POP just simply has two different waist sizes. Right now, I know of no way to rotate this beam about the optical axis to analyze the effect of the orientation of the astigmatism.


Thank you,

Cedar

Userlevel 6
Badge +2

Hi Cedar,

Thank you for the sample file. This is a simple enough example to demonstrate!

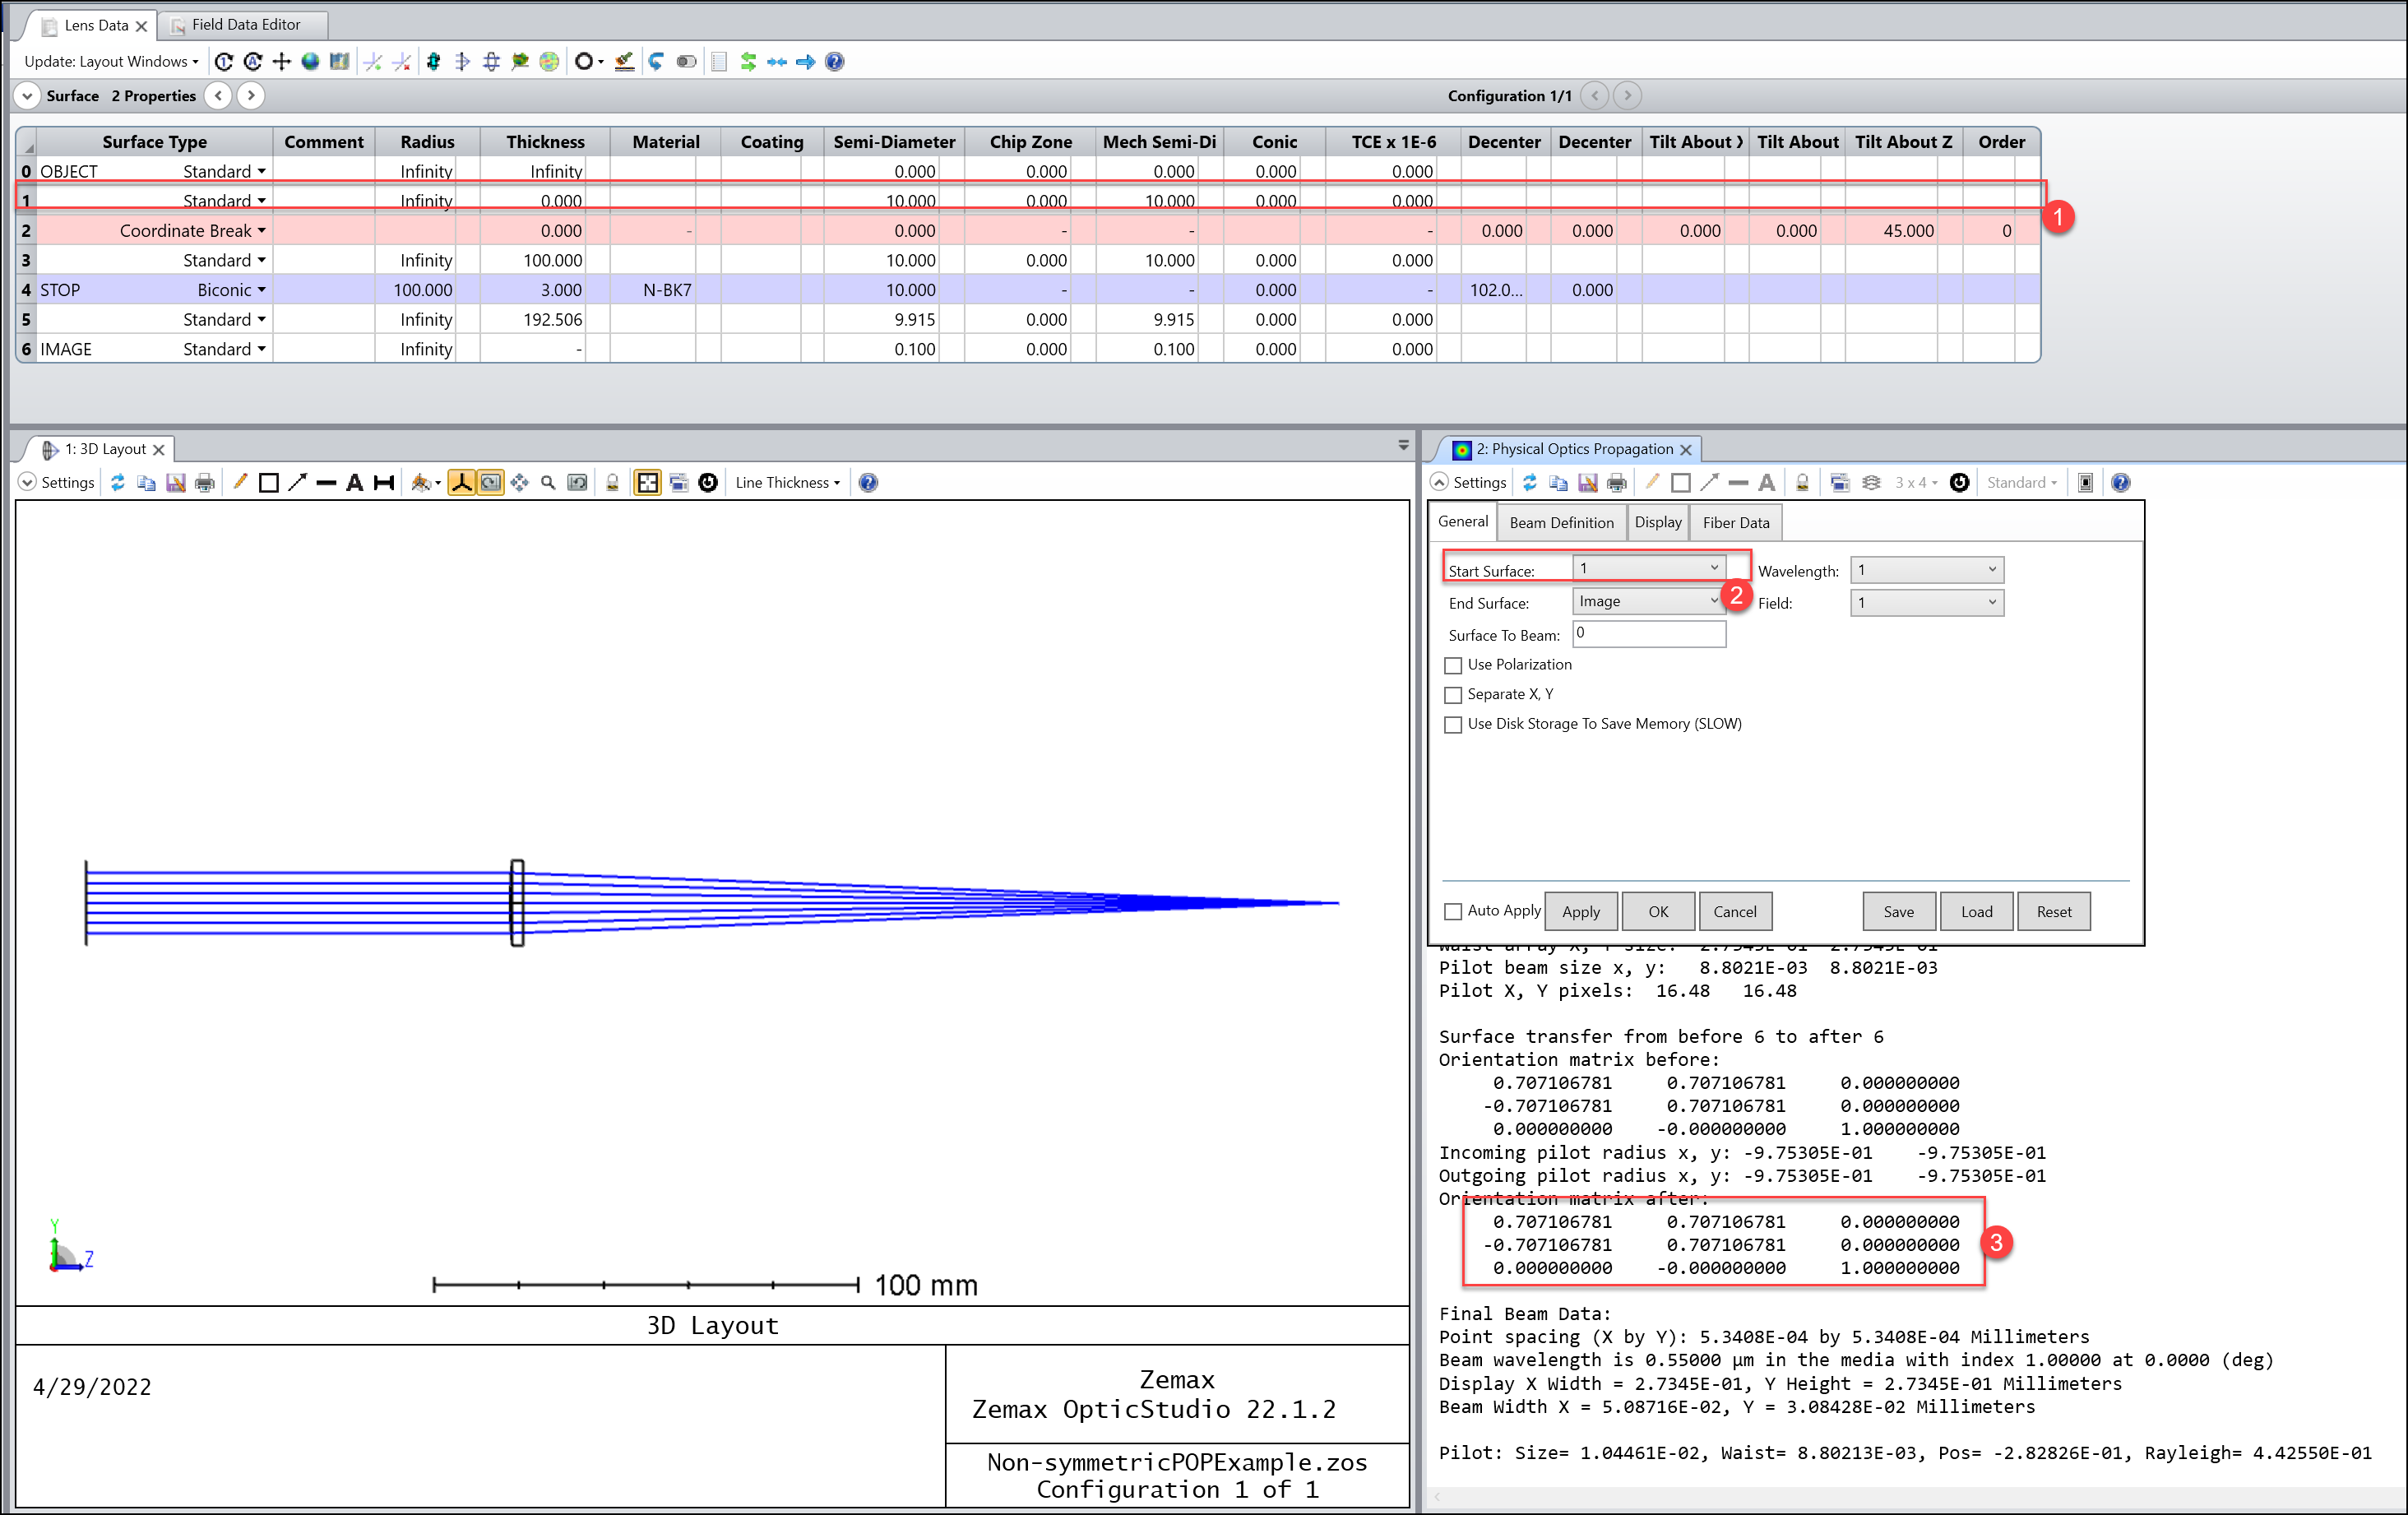
I opened your and added a dummy surface before the coordinate break. Your beam need to start from here so it will use the coordinate break. As you can see in the vollowing picture, I changed the Start Sruface in the POP settings.

Note you should check the rotation matrix is no longer identity, as shown in above picture. This means the X and Y axes in POP window as below is not same as the X and Y axes of the image plane. There is a rotation relationship between the two axes (beam and image plane), which is described in the POP Report as shown in above. This is what we mainly want to explain in this article.


Please let me know if you have more qeustions.

Thank you.


Best regards,

Michael

Hi Michael,


Thanks for your quick response! I really appreciate your help. So as long as I have a dummy surface to start with and I’m careful that I select that surface as my starting surface in POP I should be okay.


Thank you!

Cedar

Please let me ask a more basic question on coordinate systems on image planes.  I have a POP irradiance pattern showing horizontal coma energy extending to the left of the image plane center.  This agrees with a geometric spot diagram, which also shows coma energy to the left (both are attached).

The direction to the left is called the -X direction on both plots, but the OpticStudio Lens Data Editor coordinate system has +X going to the left when the +Z coordinate is pointed into the image plane (same direction as light travel).

So are the POP and spot diagram images shown as they really appear on the image plane (+X to the right)?  Or is +X really to the left and the POP and spot diagram images shown are reversed left to right from reality?

Thanks,

Chris Johnston

Reply