Report energy throughput in OpticStudio

  • 16 October 2021
  • 8 replies
  • 1027 views

Userlevel 4
Badge +1

To evaluate system throughput, there are 4 tools you can consider in OpticStudio Sequential mode, Footprint diagram, Vignetting Diagram, Geometric Image Analysis (GIA), and Transmission analysis. The Footprint Diagram and Vignetting Diagram deal with vignetting only and does not consider the Fresnel reflection or bulk absorption losses. They show what fraction of the launched rays are being blocked off/vignetted due to surface apertures. The GIA can do the same thing, but it can also consider Fresnel reflection and bulk absorption losses if you check the Use Polarization button. And the Transmission analysis always includes Fresnel reflection loss and bulk absorption loss.

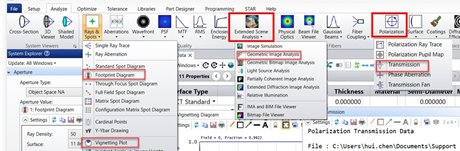
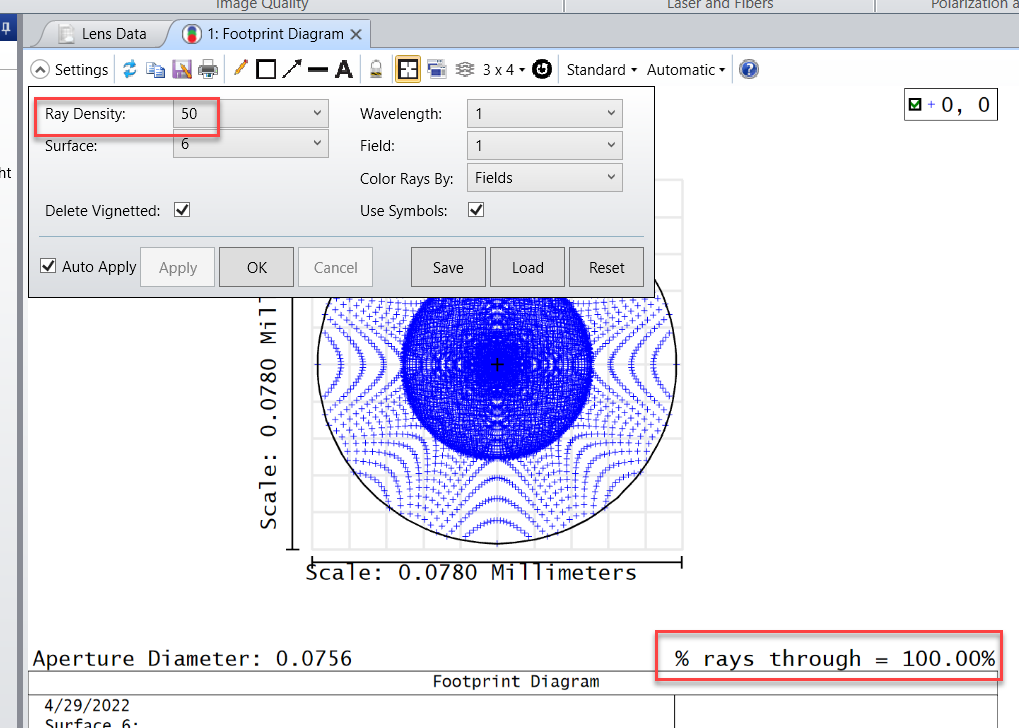
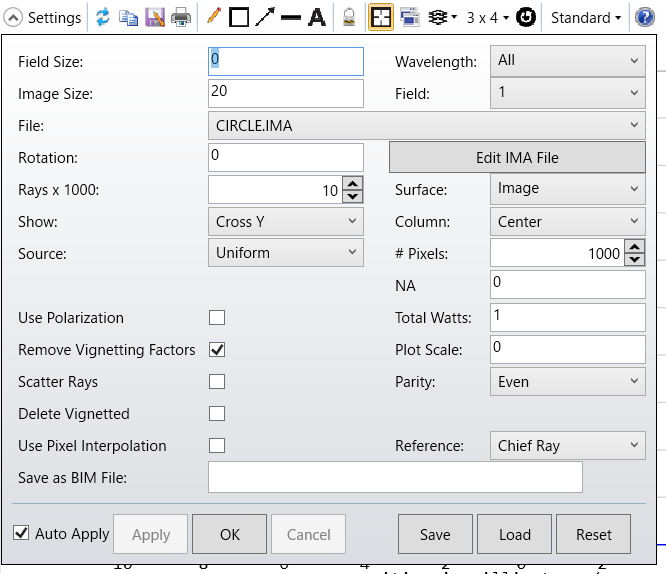
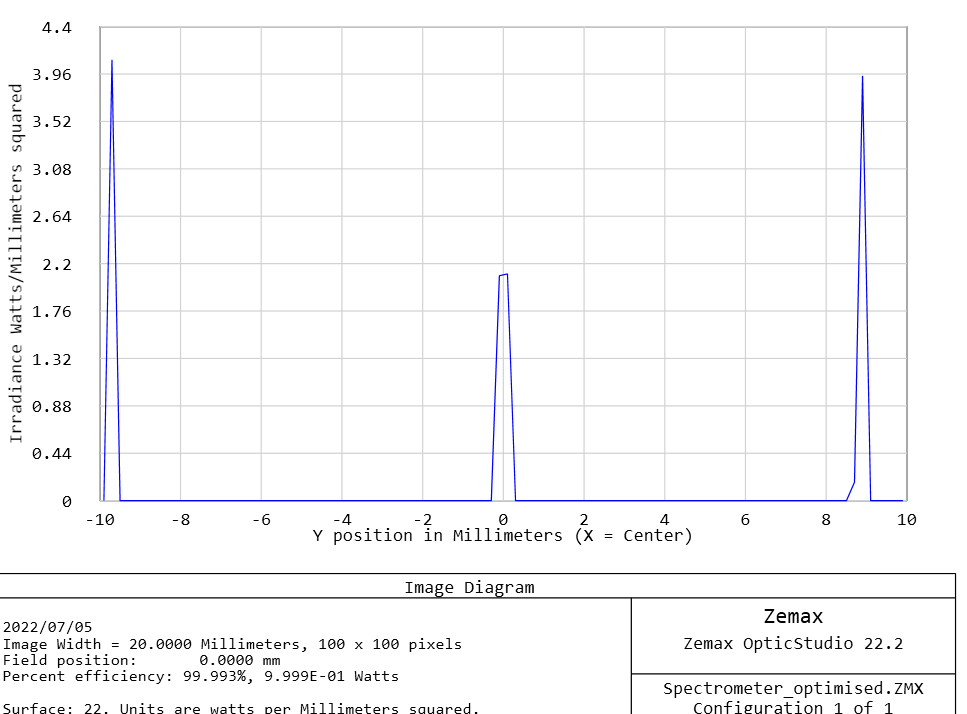
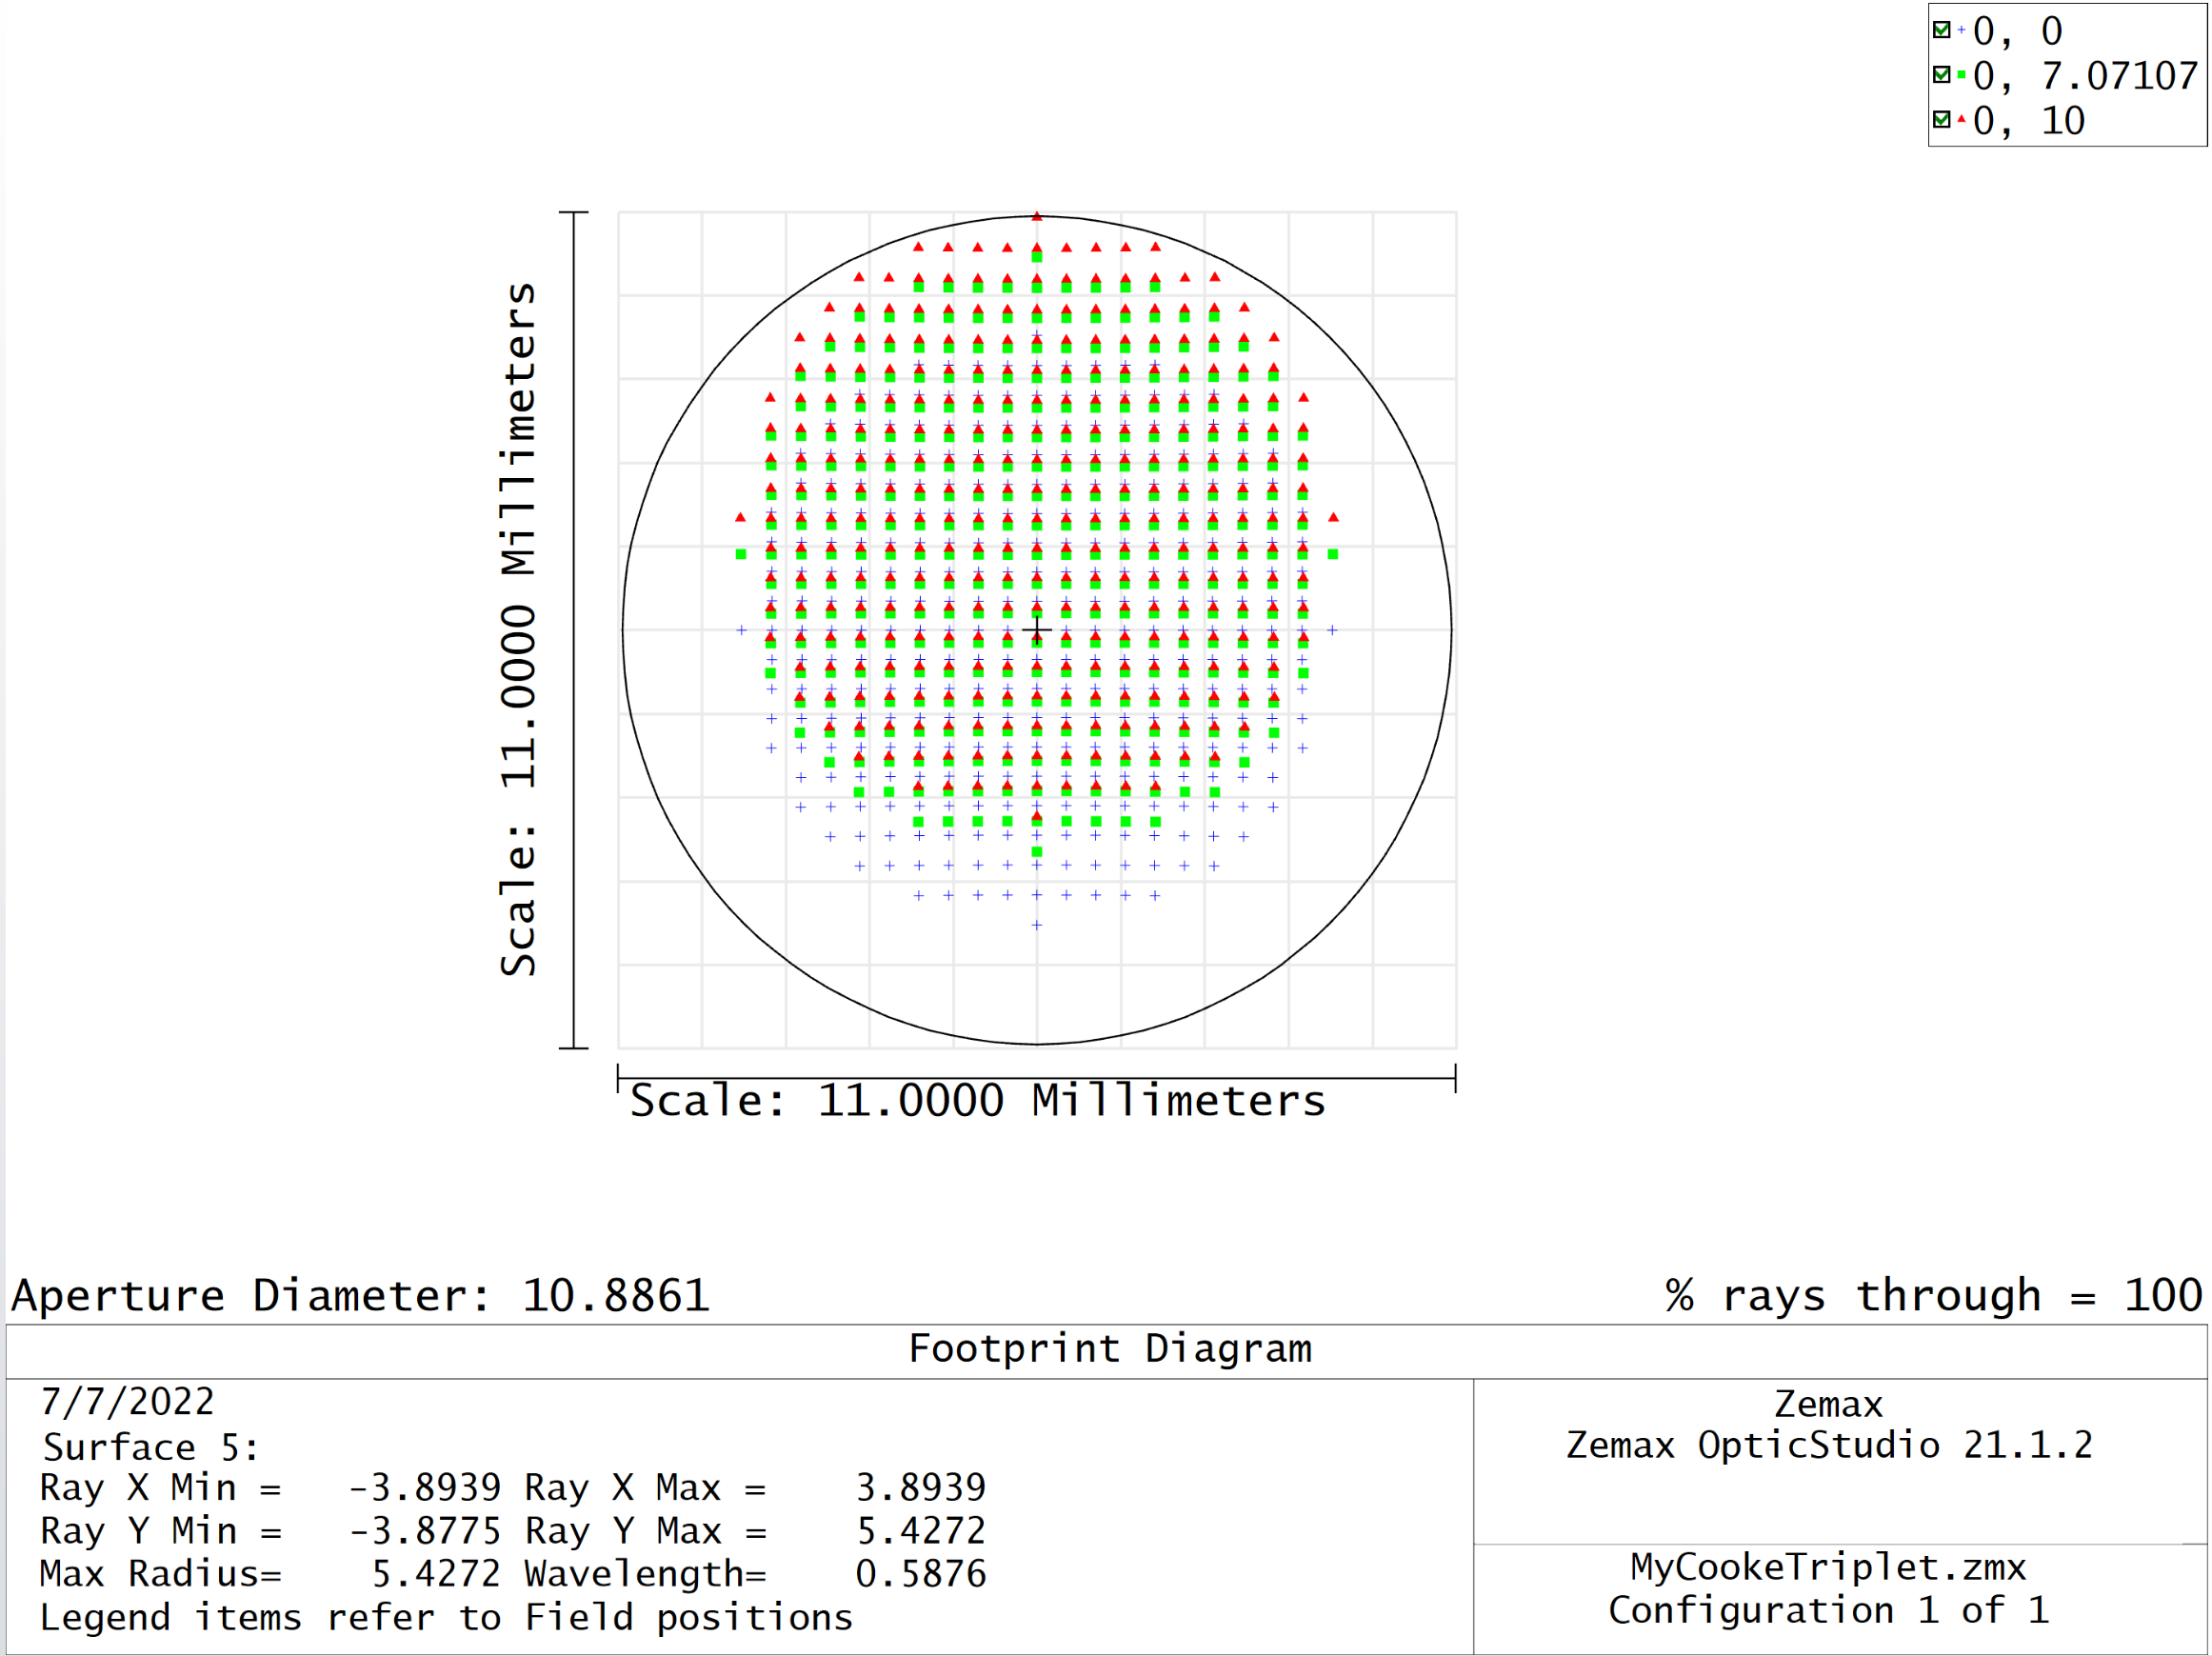
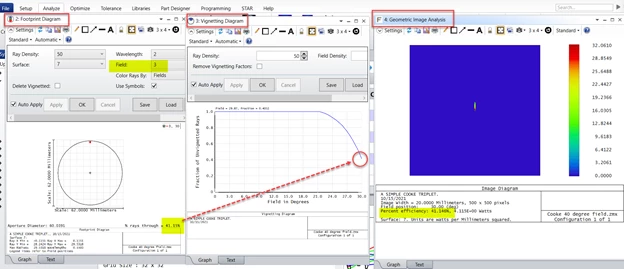
For example, in this system below, at the edge of the field 30deg, the Footprint diagram, the Vignetting Diagram, and the GIA (bottom reports “Percent efficiency %”, Use Polarization not checked) all report very similar system throughput.

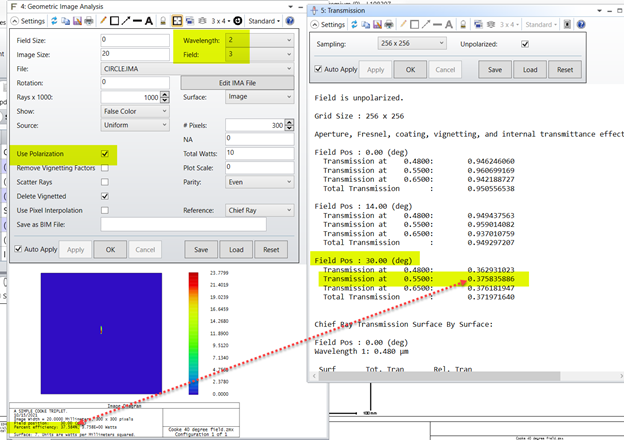
If you check Use Polarization in GIA, then it’ll consider the Fresnel reflection and bulk absorption losses. The Transmission always considers that loss. You can see in this case, considering Fresnel reflection and bulk absorption causes the throughput to drop from ~41% to 38% or so. And the GIA and the Transmission give very similar results.

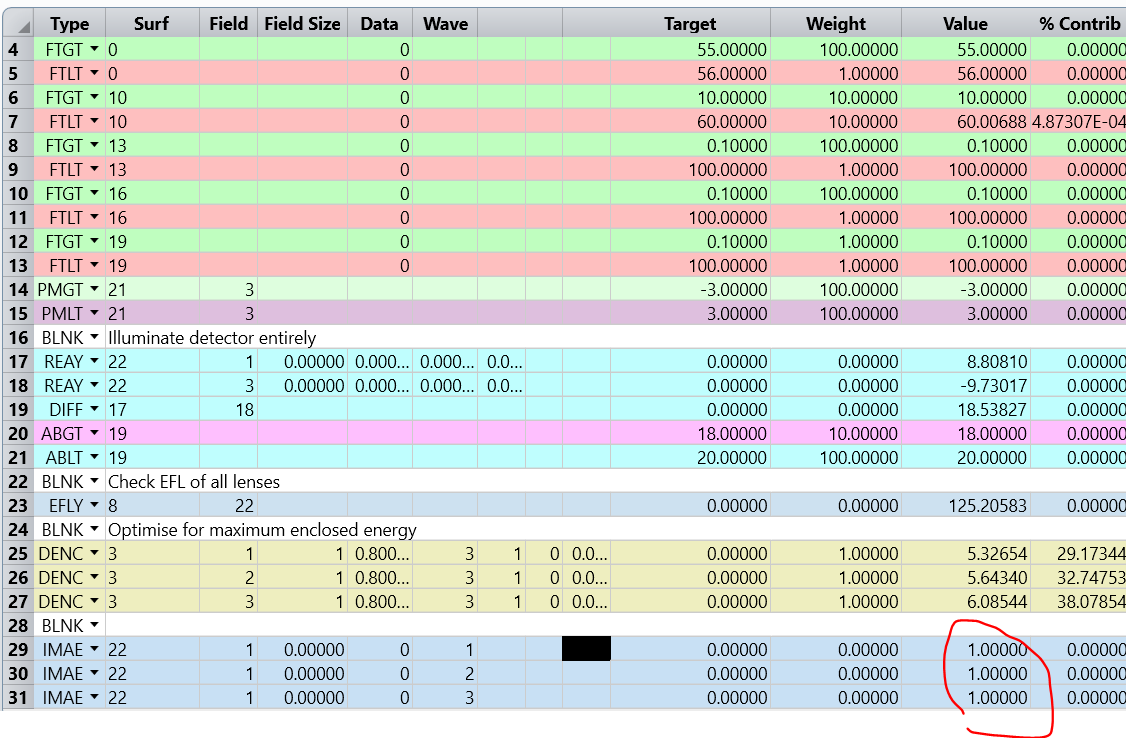
The above four analyses can be used to evaluate the throughput of your system (the fraction of the launched energy that can reach the image plane), considering different effects that lead to energy loss such as aperture vignetting rays, Fresnel reflection loss, bulk absorption loss, etc. The Enclosed energy on the other hand is only looking at what happens on a single surface. It looks at the “total” energy landing on that surface and what fraction of that energy is enclosed within certain radius. It does not deal with energy throughput of the system.


8 replies

Badge

I’m working a multiconfiguration model.  In each configuration I have a slightly different field and I would like to see how much is vignetted.  I wanted to be able to see this on the footprint diagram, but I don’t see anything telling me %rays through like you’ve indicated on the footprint plot above.  Any ideas why this might be?


Userlevel 4
Badge +1

Hi @Jed.Simmons 

In order for Footprint diagram to show % Rays Through, you need to set the Ray Density to anything other than Ring. Could you please give it a try and see if it works?


Badge

Thanks, yes that works.  It appears that I also need to have Delete Vignetted clicked in order for this to work.  

Badge

I see that in the image you sent it reads % rays through = 100.00%.  When I run my model, I see the % rays through but it only says something like 100% rather than 100.00%.  How do I get the extra precision out to two decimal places?

Userlevel 4
Badge +1

Hi @Jed.Simmons ,

My apologies for the late response. I totally missed your question above. The significant digits in the Analysis window text pane uses the default settings set by the software so I’m a bit unsure why you see no decimal points in the reported throughput % in your Footprint diagram. Could you please try opening one of our sample files, for example Cooke triplet and see if you still only see integer values in front of the % sign?

Best,

Hui

Userlevel 1

Hi Hui Chen


  I am trying to calculate the wavelength- efficiency by using energy result. I just came across some problems, would you kindly give me some advice?

I tried 2 methods as below based on the attached model

Method 1: Geometric Image Analysis

Each parameter is set as below(sensor size 20mmX20mm with 1000 pixels). And I got the result shows that the center position( wavelength) has a lowest energy( efficiency)


Settings
Result of Geometric Image Analysis


Method2: IMAE 

I have read your passage and also get some advice from zemax engineer.

An efficiency value can be got by using IMAE operand.

after save the setting of Geometric Image Analysis, I update the merit function editor

just got all the wavelength efficiency  value 1. 

Result of IMAE operand


Could you give me some advice?


  1. Is there some settings I did wrong in the Geometric Image Analysis ?
  1. Why the difference happens between the Geometric Image Analysis and IMAE operand result?
  2. The IMAE efficiency value is not the same thing as GIA result/source power?


Thanks in advance and best regards


YANG

Userlevel 4
Badge +1

Hi @Yang.Yongtao, I saw you also opened a support ticket on this topic. I’ll reply to you via the support ticket then. 

Badge

Hi Hui,

I opened the Cooke Triplet as you suggested and looked at the footprint.  This is what I see:

 You can see there is still only an integer for the % rays through.  

You mentioned that the “window text pane uses the default settings set by the software”.  Is there a way to adjust these settings?

Thanks.


Reply