

Introduction
Optical systems in aerospace industry often experience random vibration excited by internal and external forces, ranging from engine noises, scanning motions, cryogenic cooling in airborne systems to gravity, winds, and other disturbances in ground-based systems. These random motions cause optical elements to shift position therefore impact system imaging performance and lead to Line-of-Sight (LOS) jitter and loss of image quality. Vibration jitter analysis is often required in such systems to help quantify performance degradation due to jitter and help guide optomechanical design and accurate system error budgeting. In addition to the Aerospace & Defense industry, jitter is also an important topic in imaging systems used in Automotive, LiDAR, and Consumer Electronics. In general, any imaging systems experiencing random vibration may see jitter impact on system MTF performance.
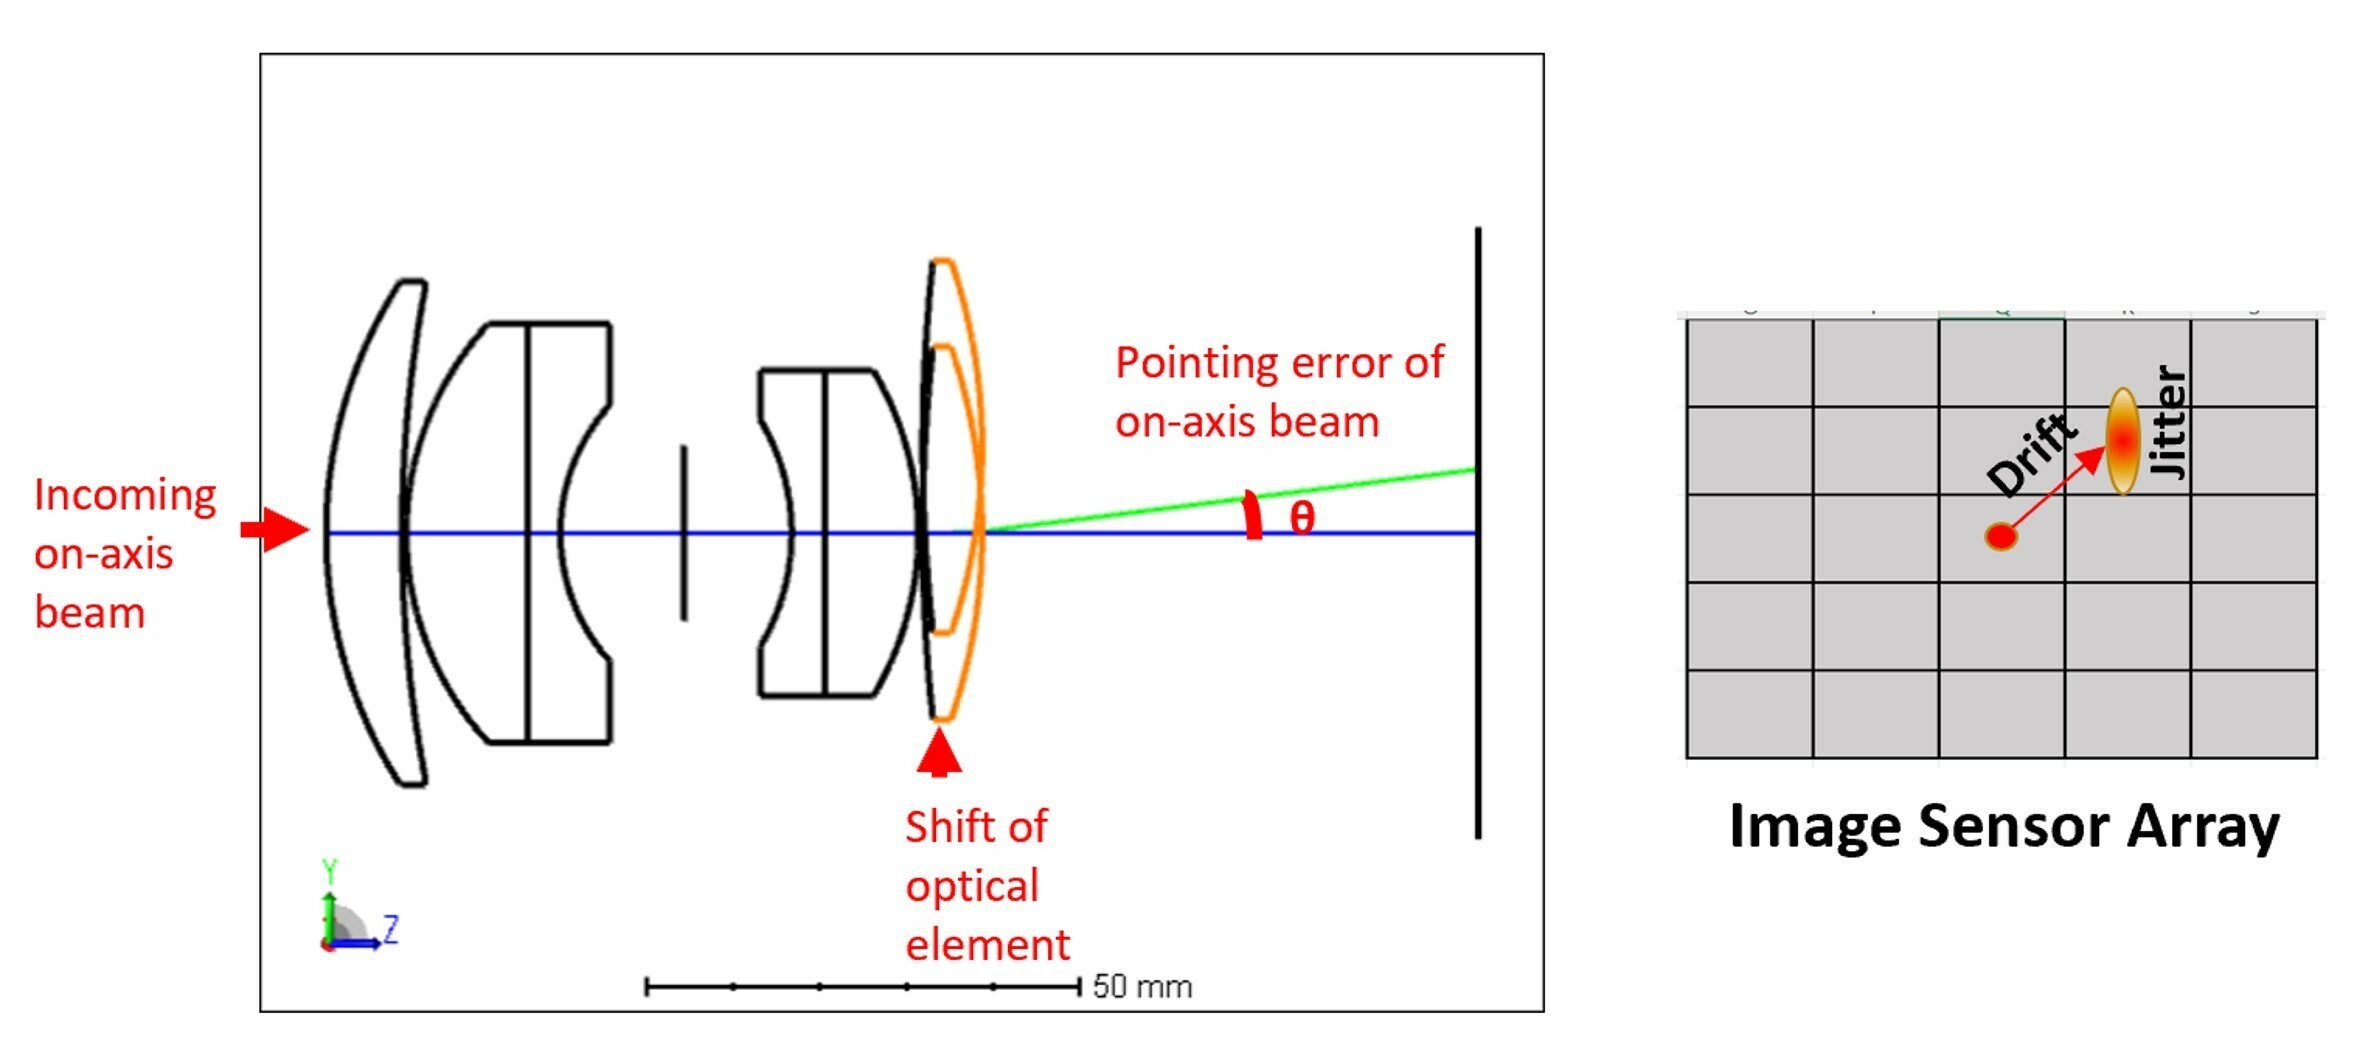
There are two types of LOS errors that are typically considered: Drift or DC pointing error which is a slow effect that mainly affects image location, and Jitter or AC pointing error that’s fast acting and affects image resolution [1,3]. With this in mind, we have separated the jitter discussion into two parts. In part 1 of this jitter series, Jitter Series Part 1: Using OpticStudio STAR module to analyze drift of Line of Sight due to temperature variation, we introduced a workflow that simulates the slow drift of LOS in a space-based telescope system due to environment thermal loads. This article is part 2 of the jitter series and we will focus on discussion of high-frequency jitter impact on PSF and MTF performance.
As we explained in the previous article, the concept of low or high frequency jitter are relative to the exposure time or sensor integration time. Generally speaking, high frequency jitter is mainly caused by vibration modes with a frequency higher than 1/T, T is the sensor integration time. For example, if the sensor integration time is 20ms, any vibration modes with a frequency higher than 50Hz will have completed one or more motion cycles within one sensor integration time. As a result, this image motion leaves a bigger PSF blur on the sensor and smears the image.
Multiphysics Workflow
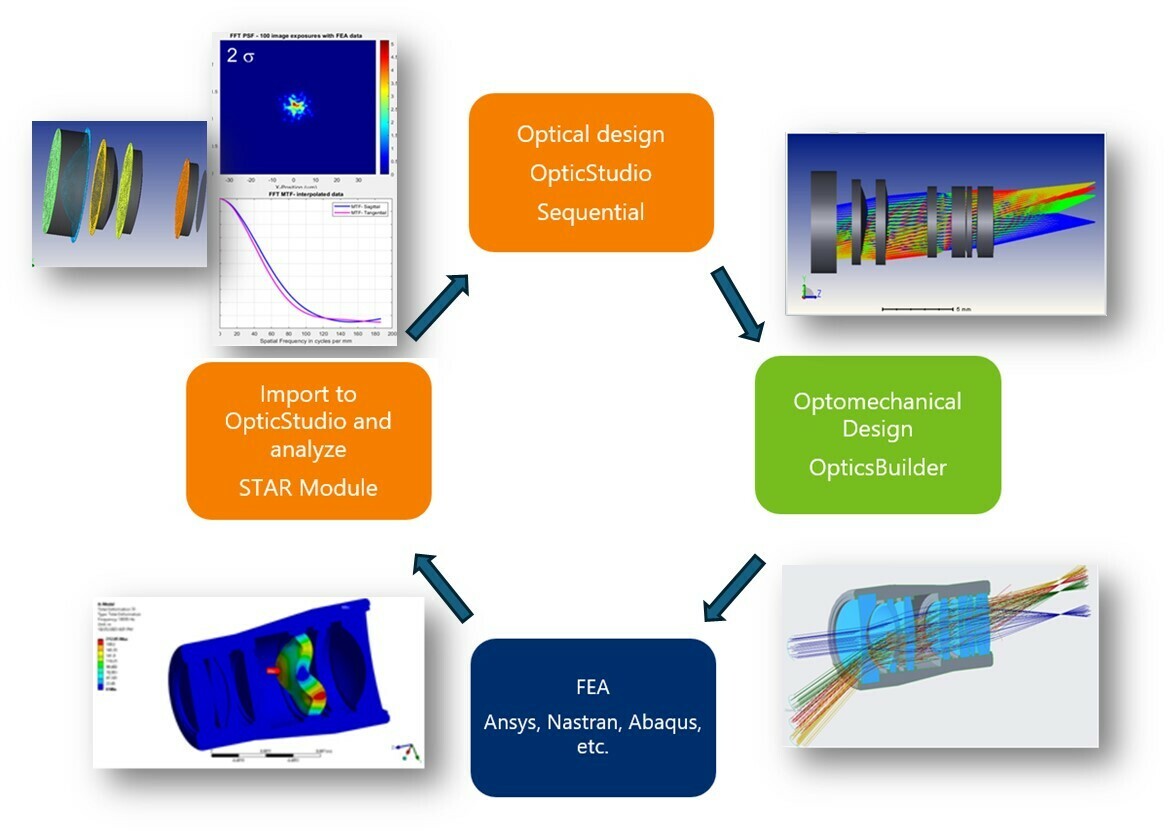
Simulating jitter impact on optical performance can be very challenging. It’s a Multiphysics and multidisciplinary system engineering task that requires collaboration among optical, mechanical, structural, and system engineers. It often requires customized scripting and data exchange among different solvers. Ansys complete suite of simulation software packages provide an end-to-end solution for optical and optomechanical design, structural and thermal FEA analysis, and STOP analysis. It enables users to incorporate structural and thermal assessment early in the design stage for more realistic modeling of performance on the system level. This not only helps designers catch critical issues early on, but also helps cut cost on prototyping and testing and shorten product time to market.
1. Optical and Opto-Mechanical design using Ansys Zemax OpticStudio and Mechanical
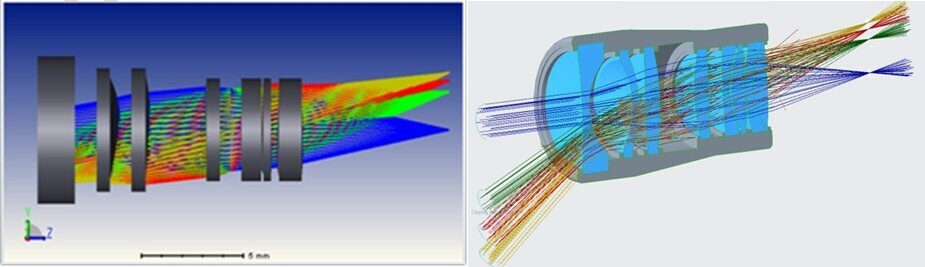
To study the high frequency jitter impact on LOS and MTF, we use a camera system as an example. It consists of eight lenses operating in visible wavelength range with 80 deg FOV. The optical system is designed and optimized to be diffraction-limited using Ansys Zemax OpticStudio. After design and optimization, the system is exported via OpticsBuilder and brought into CREO Parametric CAD platform. There the optomechanical component is designed. Next, the entire optomechanical assembly is imported into Ansys Mechanical, a structural and thermal Finite Element Analysis (FEA) solver for Random Vibration analysis.
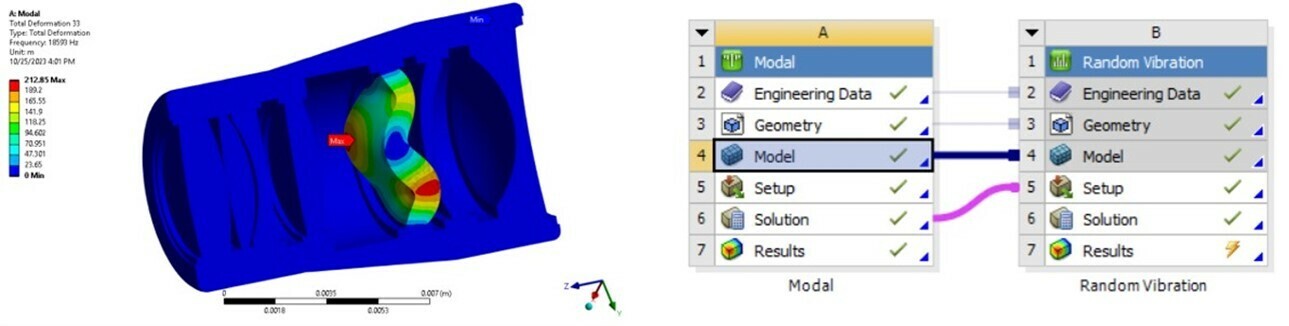
2. Modal analysis and Random Vibration analysis using Ansys Mechanical
We use Ansys Mechanical to perform Random Vibration analysis of the optomechanical assembly. Modal analysis is performed first. Modal analysis identifies the natural frequency and mode shape of each vibration mode. It also generates the Frequency Response Function (FRF) of the system. Results from Modal Analysis are then used as input for Random Vibration analysis. Random loads are applied to the structure as input to excite vibration modes. Structural responses, such as element displacement and deformation are calculated [2].
3. Structural & Thermal Optical Performance (STOP) analysis using Ansys Zemax STAR module
For Random Vibration, system input and response are both random in nature. In general, random loads can have frequencies over the entire frequency range and capable of exciting all structural resonant frequencies simultaneously. This makes it difficult to predict vibration magnitude precisely at a given point in time. Because of this non-deterministic nature of the motion, statistics are often used to describe structural responses including directional displacement and deformation in Random Vibration [2].
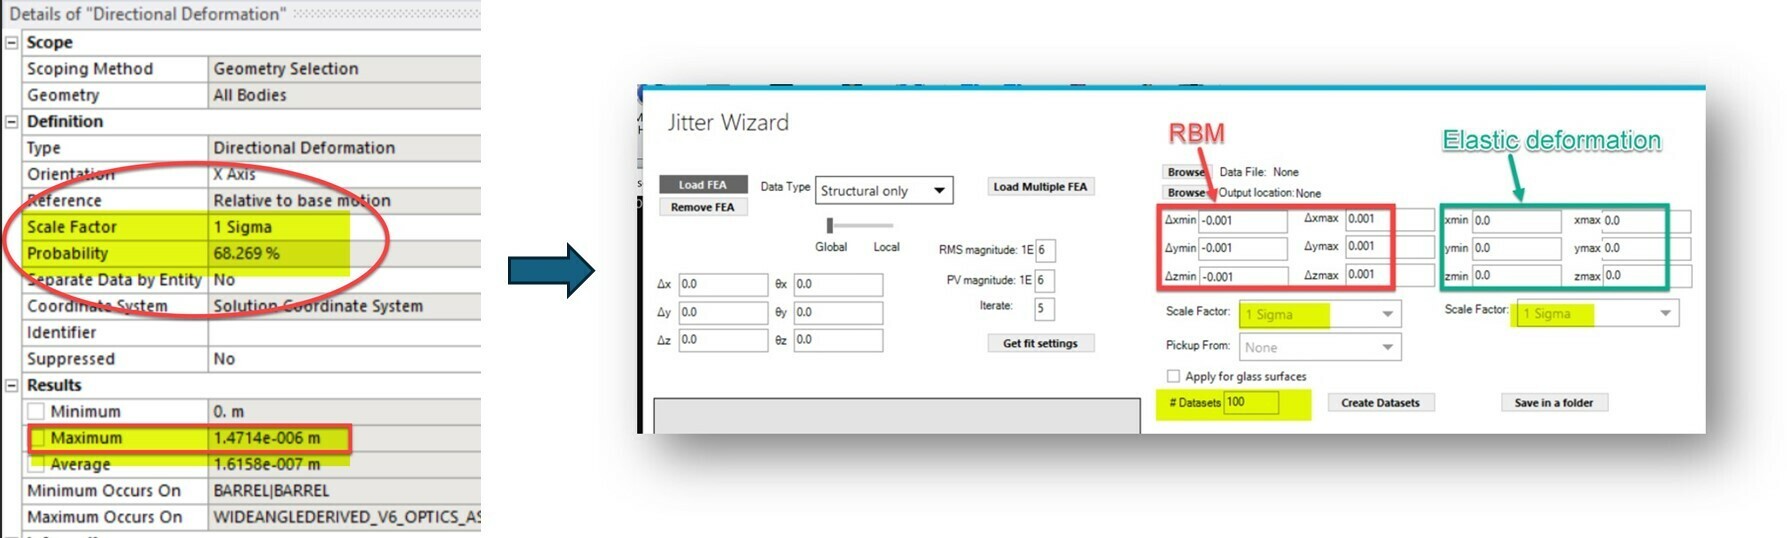
Often you see Random Vibration simulation reporting results as shown in the left graph below. It reports the directional displacement and deformation magnitude as a statistical distribution, for example 1 s displacement is 1 um, meaning 68% of the time the element moves within +/- 1um. To help create an interface between Random Vibration analysis and Zemax OpticStudio STAR module to bring this statistical distribution of element movement into OpticStudio, a User Extension was developed which can be used to generate large quantity of structural datasets. This User Extension takes the statistics generated by Ansys Mechanical Random Vibration analysis as input. Running the extension can create any number of structural datasets and the displacement contained in these datasets follow the same statistical distribution as predicted by Ansys Mechanical. Then these datasets are loaded into OpticStudio STAR module to simulate the random movement of optical elements during vibration.
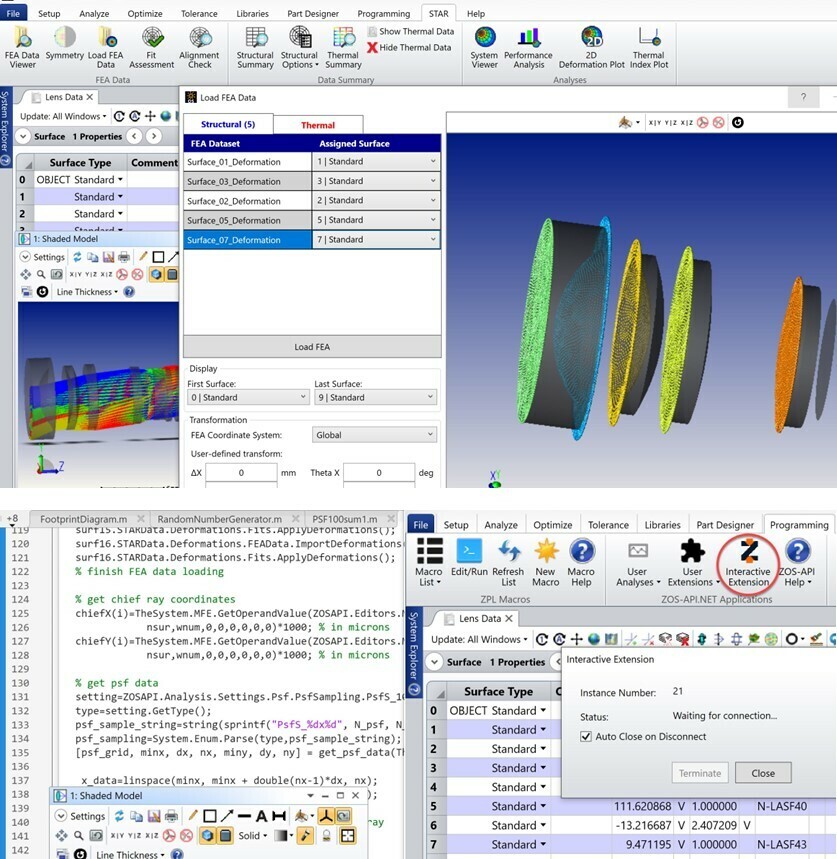
OpticStudio STAR module supports direct loading of structural deformation and temperature data from FEA analysis into OpticStudio for ray tracing. This enables users to analyze optical performance degradation due to structural and thermal impact. Since the workflow involves loading/unloading many sets of structural and thermal data, we recommend using API script to automate the entire process.
In this example, we’ve studied random vibration jitter impact on system PSF and MTF using 3 sets of statistical distribution, +/- 1um as 1s, 2s, 3s displacement, respectively. Enter these statistics into the User Extension, set the “# Datasets” to 100, and run the Extension. It will generate 100 sets of structural data for each optical surface in the system in just minutes. There are 15 optical surfaces in the system so a total of 1500 sets of structural data need to be generated. Each set of structural data describes one position of each optic at a given moment, and we use 100 such dataset to sample random movement of each optic under vibration. You can think of each dataset as capturing one “frozen frame” of the system. As the elements vibrate at high frequency, the image centroid and PSF also move around at high frequency on the sensor array. This results in a bigger PSF blur than the PSF calculated in the nominal, motionless system.
We use the API script to load these structural datasets in sequence, ray trace, and analyze centroid location and PSF on image sensor. In the script we also integrate all 100 PSFs captured from each of these “frozen frames” to form a bigger PSF jitter blur. Finally, we use this jitter PSF to calculate the real MTF of the system under vibration. We also report the LOS jitter by tracking the centroid movement on sensor.
Analysis & Results
In this section we will discuss some of the analysis results obtained.
1.Tracking Centroid movement
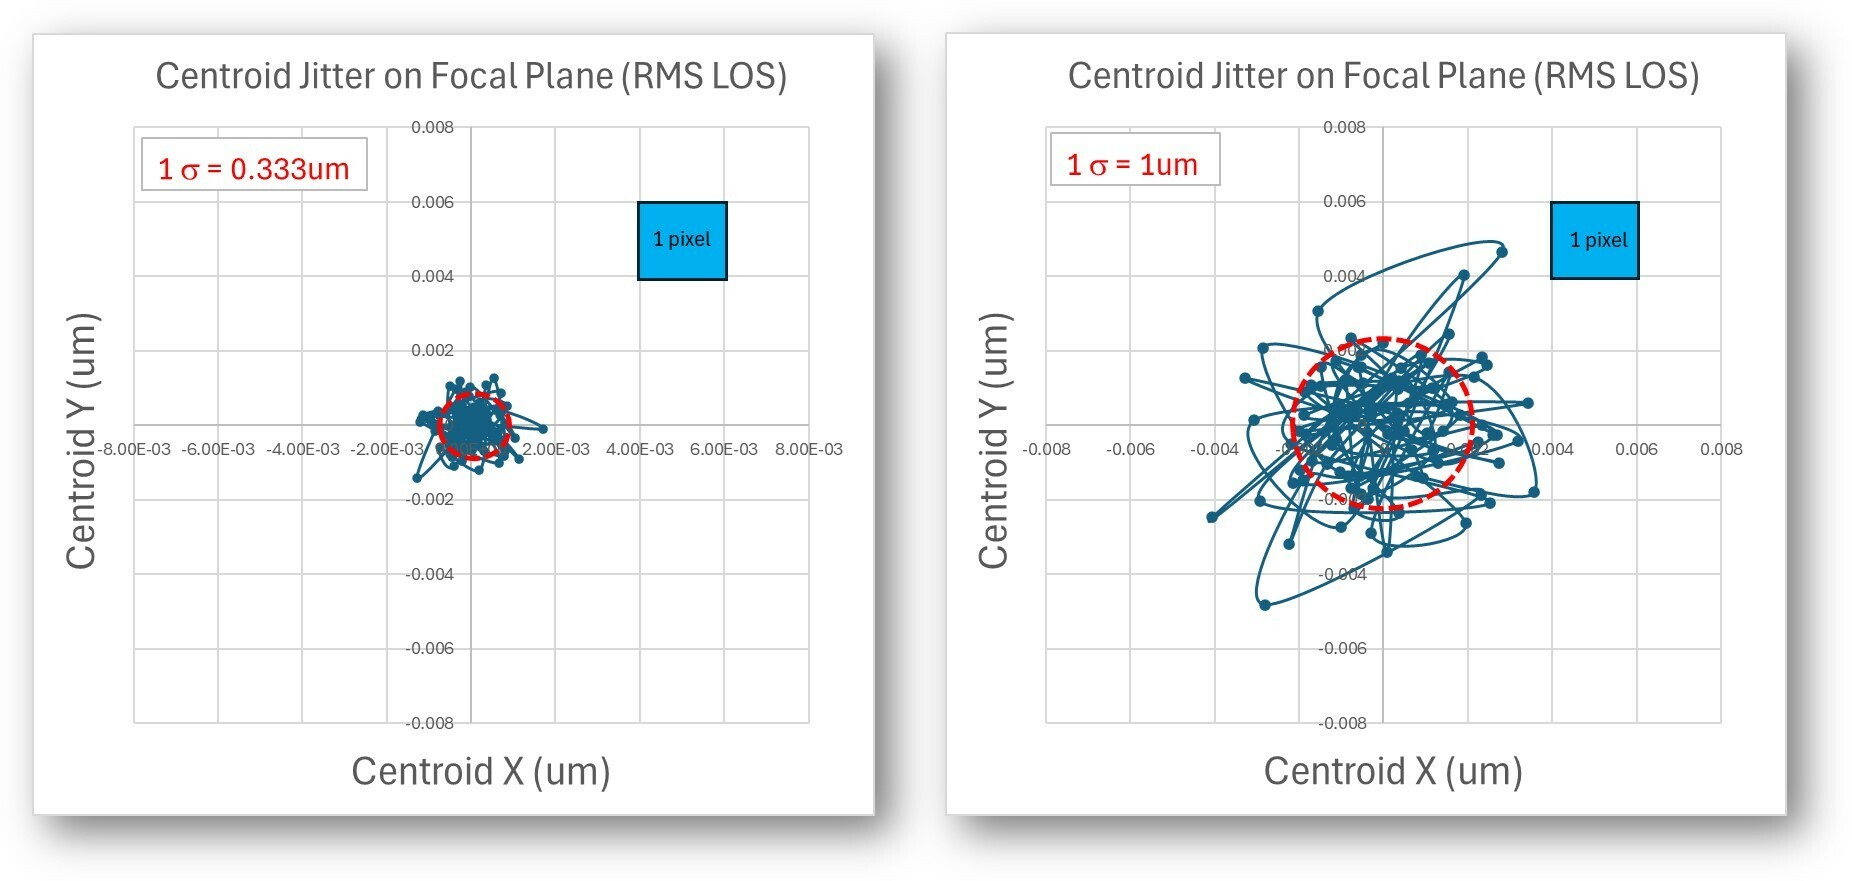
To analyze the LOS jitter, we use operand CENX and CENY to report the centroid movement of the on-axis field on the image sensor. As you see below, the left graph shows the centroid movement for element 1s displacement at 0.333 um, whereas the right graph shows the movement for element 1s displacement at 1 um. The left graph shows a centroid trajectory tightly confined in the center with an RMS LOS error around 0.77 um, while the right graph shows the centroid moves across many pixels with a larger RMS LOS error at 2.3 um. Running this type of analysis can help designers decide if high frequency jitter will lead to a significant image registration error. And if so, redesign of the optomechanical assembly, for example lightening or stiffening certain part of the structure may help modify structural responses to random vibration therefore improve jitter MTF performance.
2.PSF integration and jitter MTF calculation
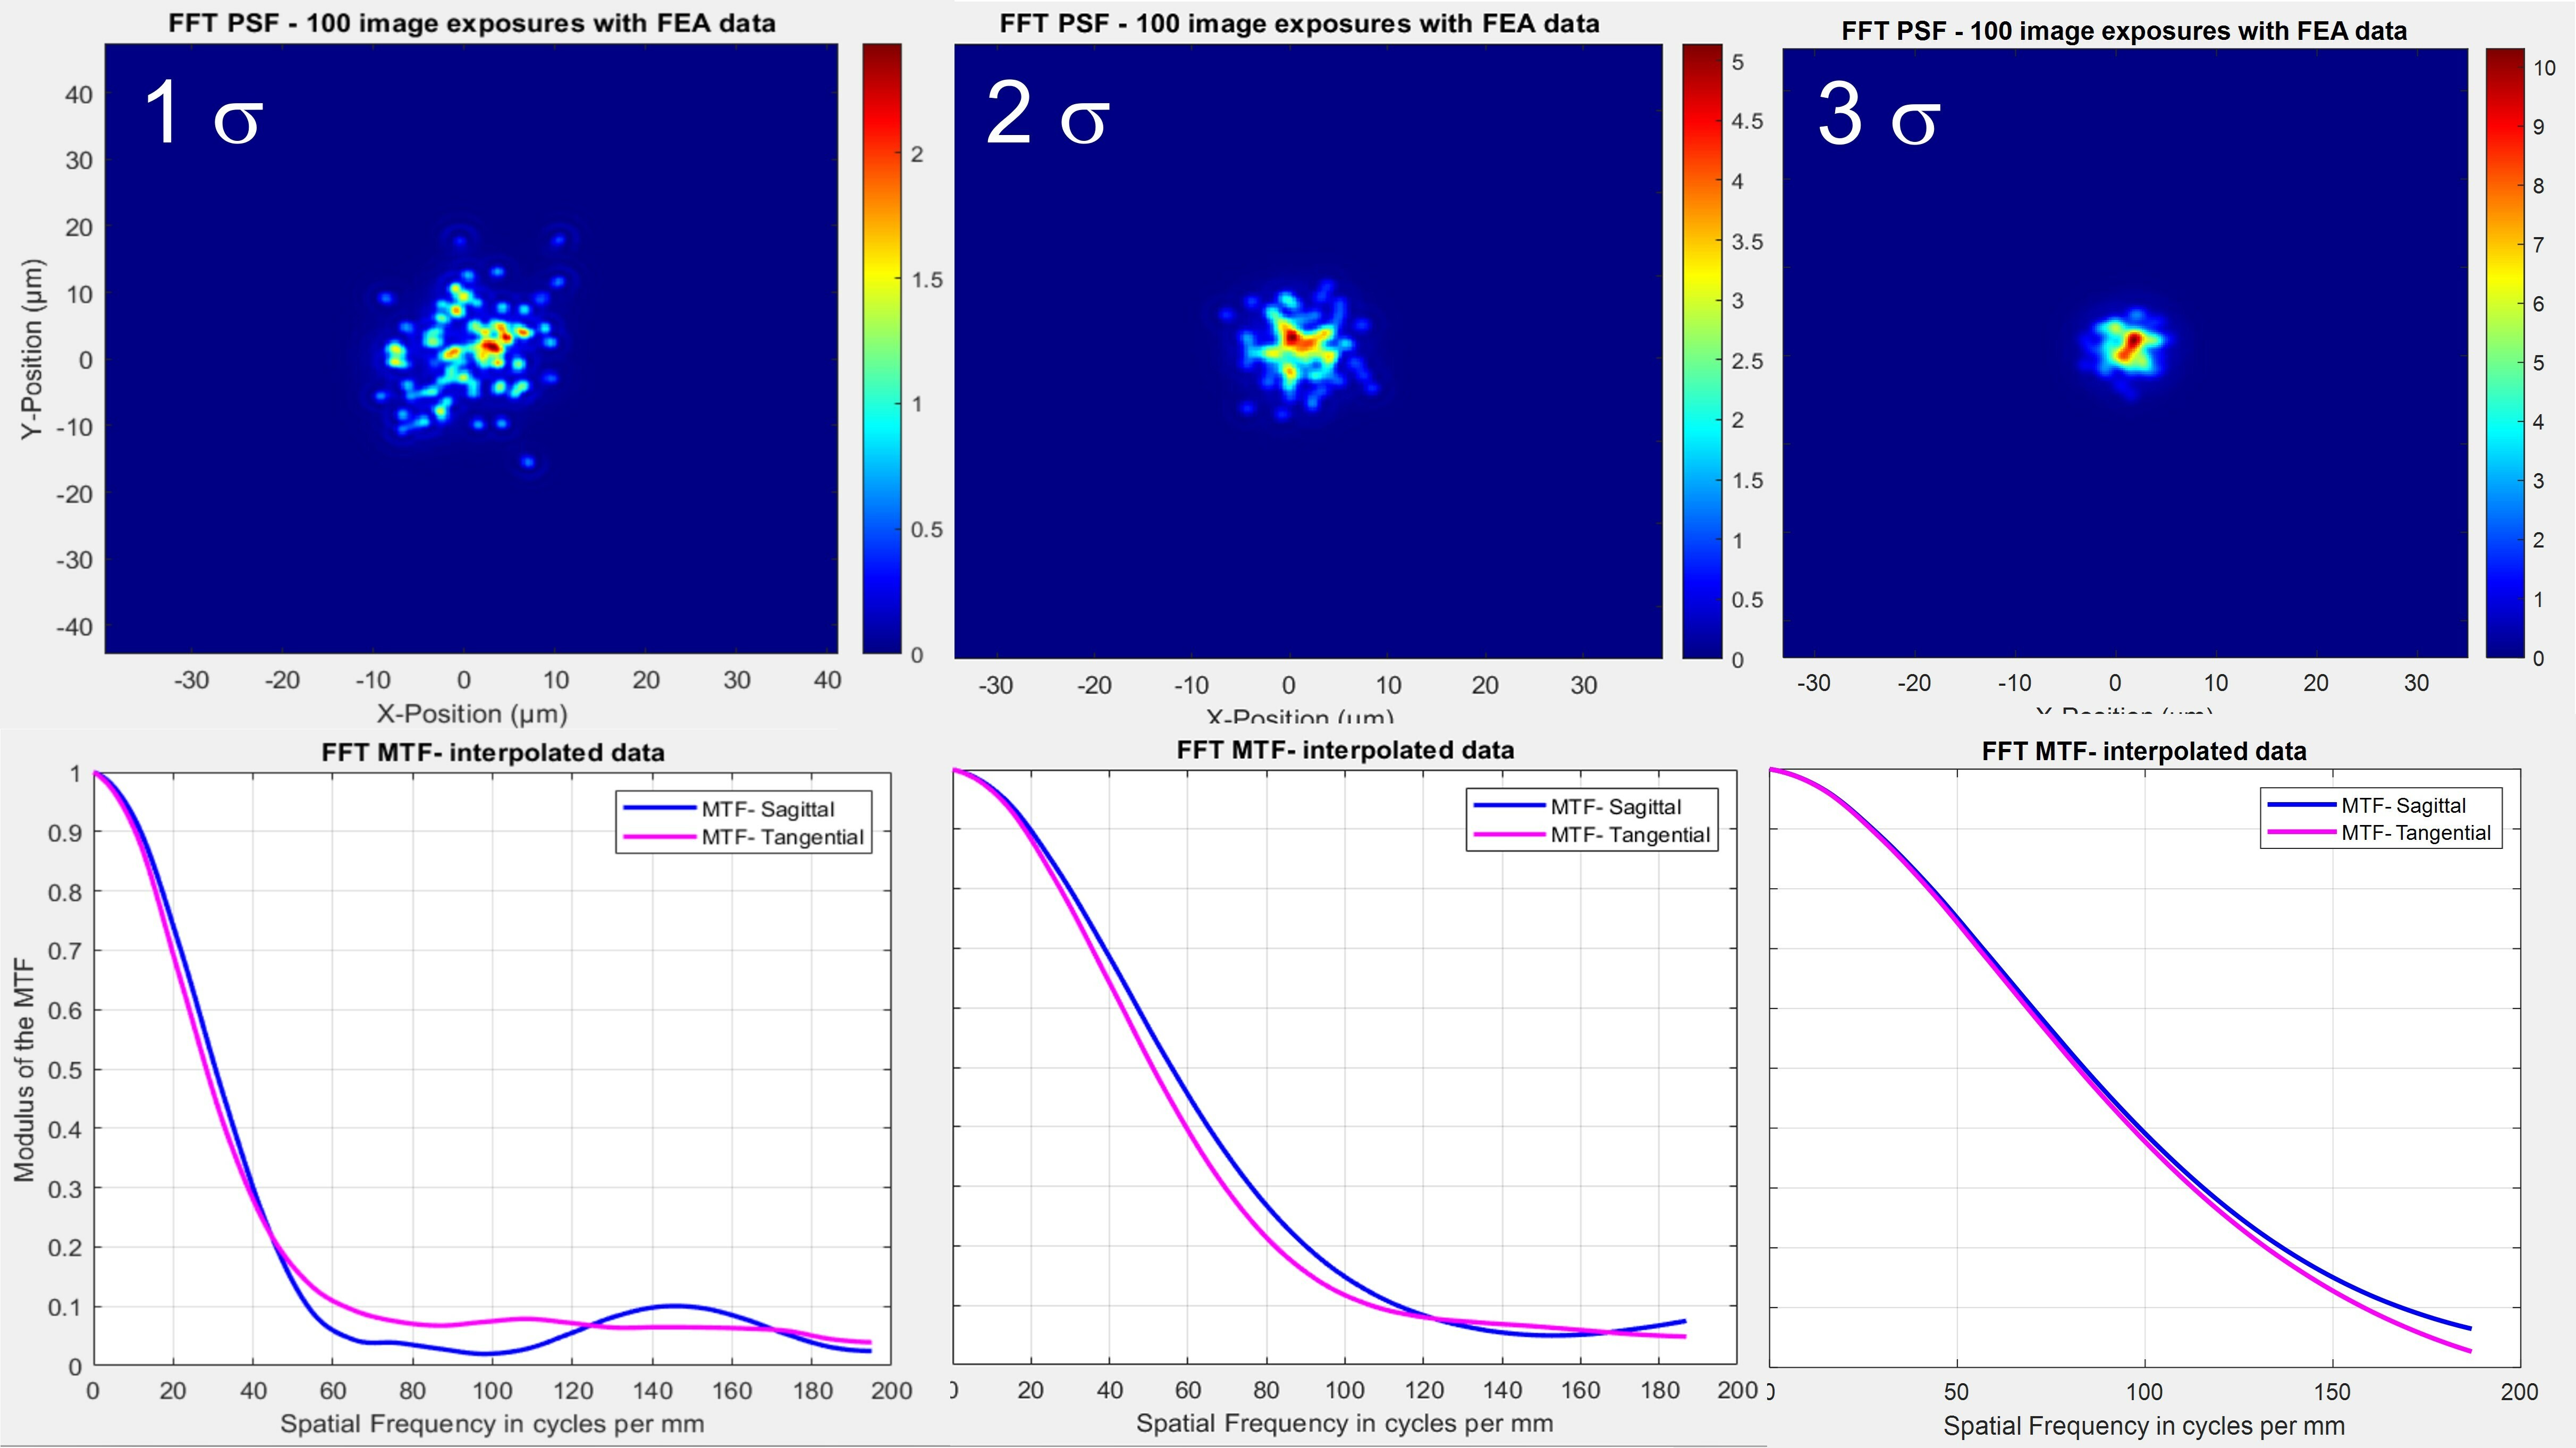
To address PSF blur and MTF reduction due to high frequency jitter, an integration/overlay of many PSFs has been performed. Each PSF describes one random position of the system at a given transient within one sensor integration time. We can use as many such time transients as needed to describe random movements of the system. Then we integrate all these PSFs to estimate the size of the final jitter PSF. A Fourier Transform is performed on this integrated PSF to calculate the system MTF due to fast vibration jitter.
For each of the graphs below, we used 100 sets of structural data to describe the element movement. As mentioned in the earlier section, the movement of the optics under random vibration are random in nature and best described using statistics. Below we show the PSF and MTF curve for three different statistical distributions of the movement, 1s, 2s, and 3s at +/- 1 um. As you can see from these graphs below from left to right, as the magnitude of the random motion decreases, the integrated PSF blur decreases in size as expected. This workflow helps visualize the spreading of the PSF due to high frequency random vibration. It also provides a quantitative evaluation of the jitter MTF. For example, in this sample system the results indicate that to maintain an MTF > 0.4 at 100lp/mm, the 1 sigma displacement due to vibration needs to be controlled to be within a third of a micron.
Discussion and What's Next
The prototype workflow described here provides a rough estimation of the system's PSF and MTF due to elements' random displacement under high frequency vibration. It's important to note that though this prototype workflow addresses some aspects of the jitter issue, it does not provide a complete solution to the problem. This workflow mainly targets the random movement of each element during vibration. However, depending on the elasticity of the lens material, high-frequency vibration modes can also cause surface deformation which will lead to wavefront aberration and impact MTF as well. Evaluating surface deformation due to random vibration is quite challenging. All natural frequencies of the structure will be excited simultaneously and the surface deformation is a combined effect from all vibration modes present. Part of the challenge here is that Random Vibration analysis solver can predict deformation magnitude of each points on surface using statistics, for example point A has a 1 sigma (68% of the time) Z directional displacement at 1 um, whereas a neighboring point B at 0.5um, but the phase information is not included as an output, meaning the relative position of point A and B at a given moment is not directly provided. As a result, we don't have a surface deformation map readily attainable from Random Vibration analysis to bring into optical solver for ray tracing. And this missing information is very important if we want a robust and complete solution to address jitter impact in systems where surface elastic deformation is of concern.
In addition, Random Vibration analysis solver tends to deal with structural response in frequency domain using Power Spectral Density (PSD) curve. It would be desirable if we could generate a performance PSD response curve to tie system LOS error and MTF with individual vibration frequency. This can help identify critical modes that contribute most to LOS error. And the information can also help guide optomechanical design to eliminate or suppress response of those critical modes. [1,2]
That said, the Jitter analysis is more of a system level engineering task. Bringing all movements back into optical model to ray trace and simulate performance is just one route to explore the jitter effect. There are other approaches we could consider, for example, creating a system LOS error budget to properly budget/allocate LOS error for optomechanical tolerances and random vibration jitter can be another solution.
Overall, jitter analysis of optical systems under random vibration is a very complex topic that requires cross-disciplinary collaboration and research and development effort. It's still Work in Progress and our team is exploring different options to better interface the Random Vibration analysis with Zemax OpticStudio. If this is something of interest to you, please feel free to reach out to Zemax support team for further discussion. We would love to hear from you so we can better understand customer’s needs for jitter analysis.
To summarize, in this study we have developed a Multiphysics workflow to analyze optical system performance degradation due to random vibration jitter. Random Vibration of imaging systems causes elements to shift position and lead to LOS error. Depending on the frequency of the vibration motion, it can impact the location of the image as well as the image resolution. Using the two API scripted workflows demonstrated in this Jitter series, user can estimate jitter MTF under high frequency vibration, as well as track image drift due to slow thermal effect.
Ansys offers a complete Multiphysics product portfolio that supports optical, mechanical, and structural FEA analysis to meet users’ simulation needs. Particularly, Zemax OpticStudio STAR module serves as the interface between the structural and optical software, making it much easier to bring FEA data back into optical simulation software to enable a streamlined STOP analysis workflow. STAR allows the structural & thermal impacts on optical performance to be analyzed early in the product design cycle so optical designers can spot critical issues early on and deliver better products to market sooner!
This work is done by Ansys Zemax ACE team members, Hui Chen, Julia Zhang, Mojtaba Falahati, and Christophe Weisse.
REFERENCES
[1] Genberg, V. L., Doyle, K. B. “Integrated Opto-Mechanical Analysis,” University of Rochester, Summer Short Course 2021
[2] Ansys Innovation Space, Random Vibration Analysis course, https://courses.ansys.com/index.php/courses/random-vibration-analysis/
[3] Genberg, V. L., Michels, G. J., Doyle, K. B., “Integrated modeling of jitter MTF due to random loads,” Proc. SPIE 8127, (2011)