Alternative way to simulate for coherence length

  • 11 October 2021
  • 13 replies
  • 1144 views

Userlevel 6
Badge +2

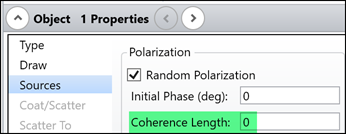
In OpticStudio, an option is available for assigning Coherence Length to a source as shown below. This works based on randomizing the wavelength of each ray.


In this post, an another method is demonstrated for simulating coherence length. In this method, it’s assume light with different wavelength cannot interfere. In other words, the interference pattern of a multi-wavelength source is the incoherent sum of the interference pattern of each wavelength themselves.

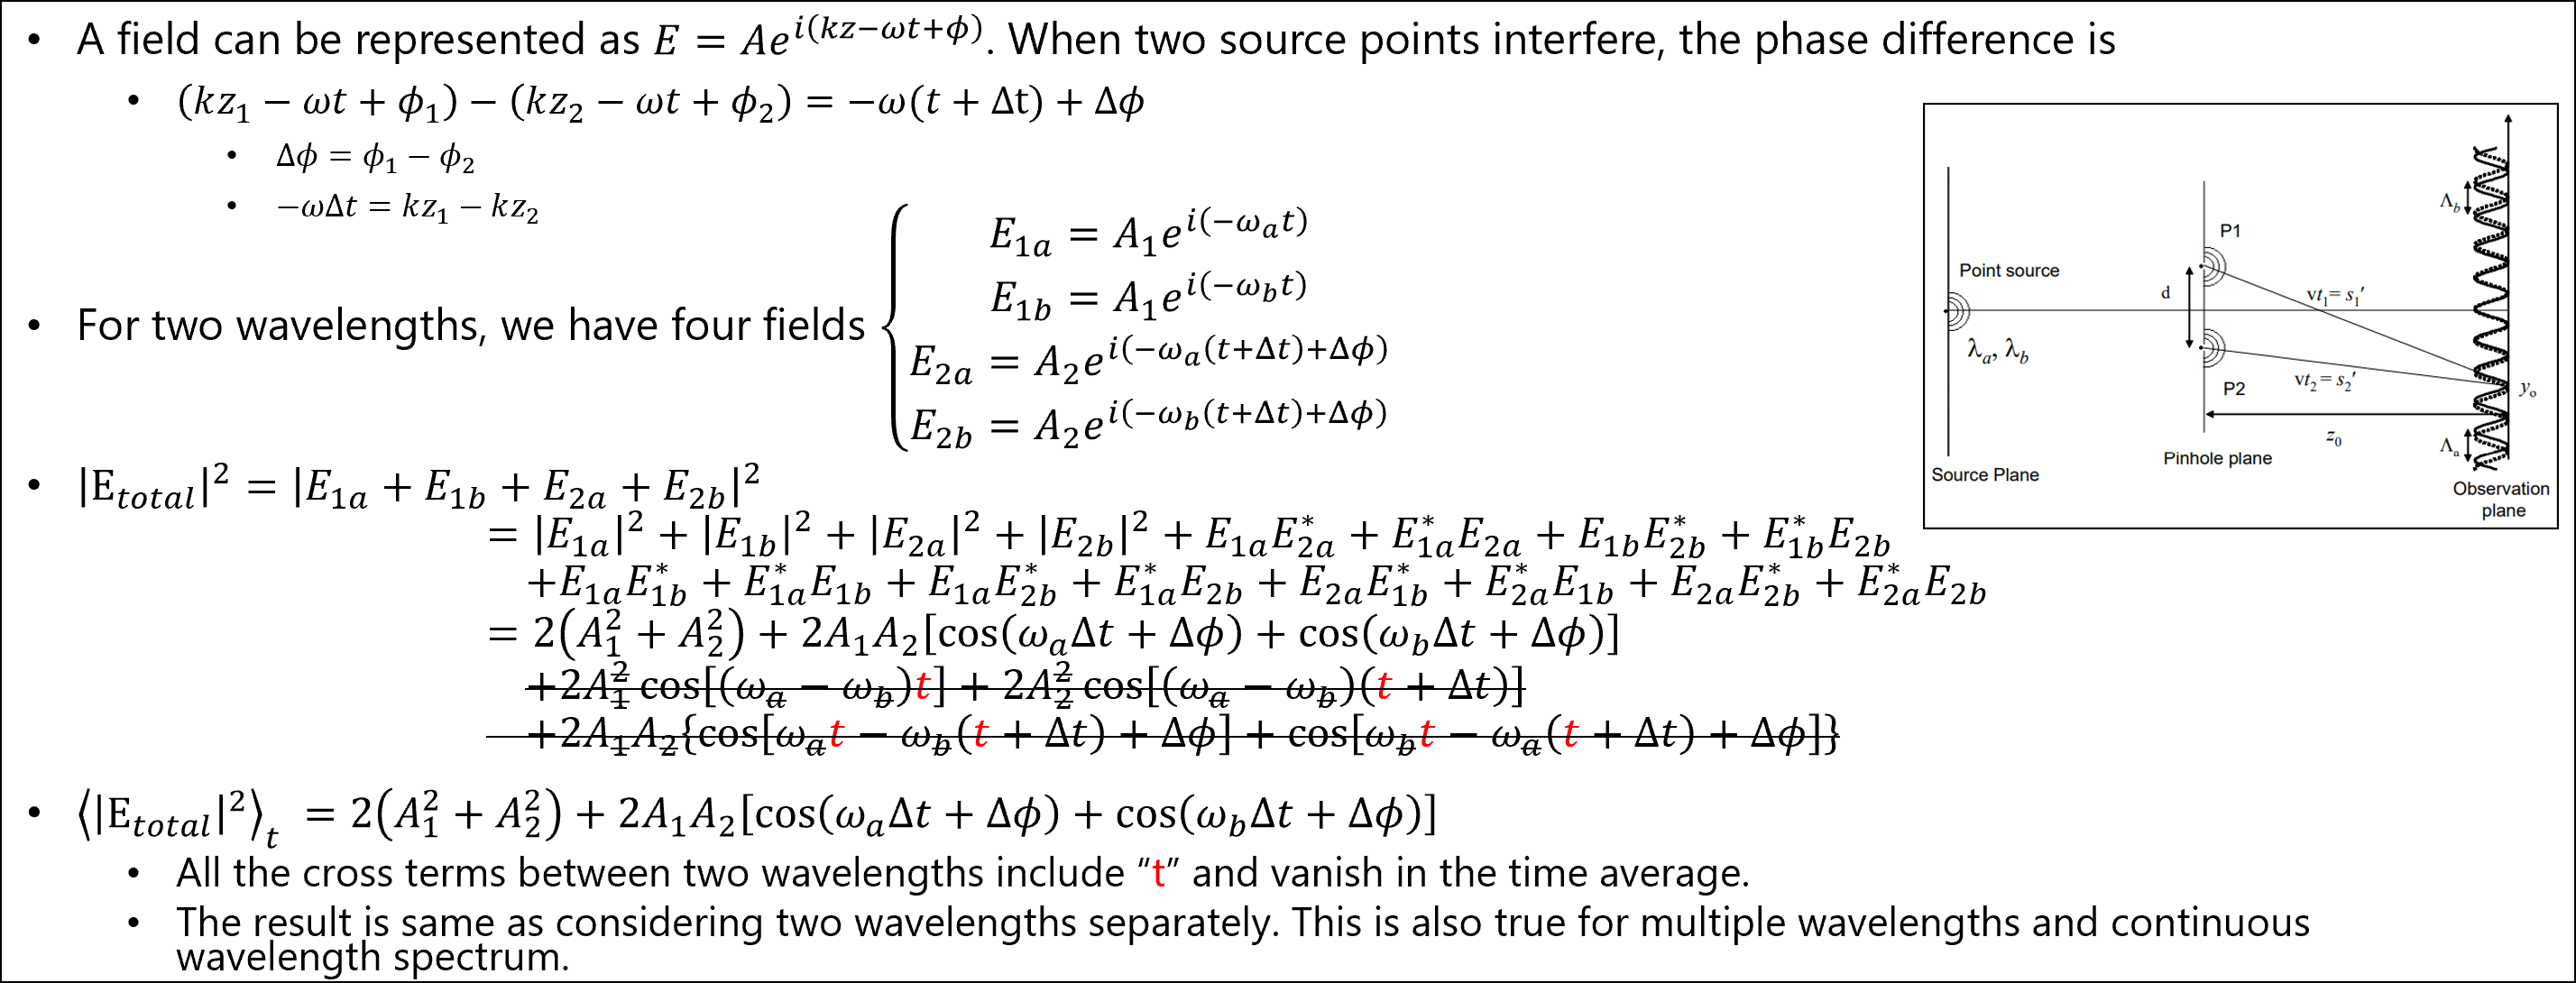
In fact, light with different wavelength could interfere. However, the interference pattern cannot be detected because the pattern changes with very high frequency and vanishes when sensor averages it over time. The following picture explains it.


To calculate the interference pattern of each wavelength and incoherently sum them, we need to do it manually. Here we provide a simple case and an ZOS-API code to demonstrate how to do it.

To see how it works, users just need to open the attached ZAR file, turn on Interactive Extension Mode, and run the attached MATLAB code.

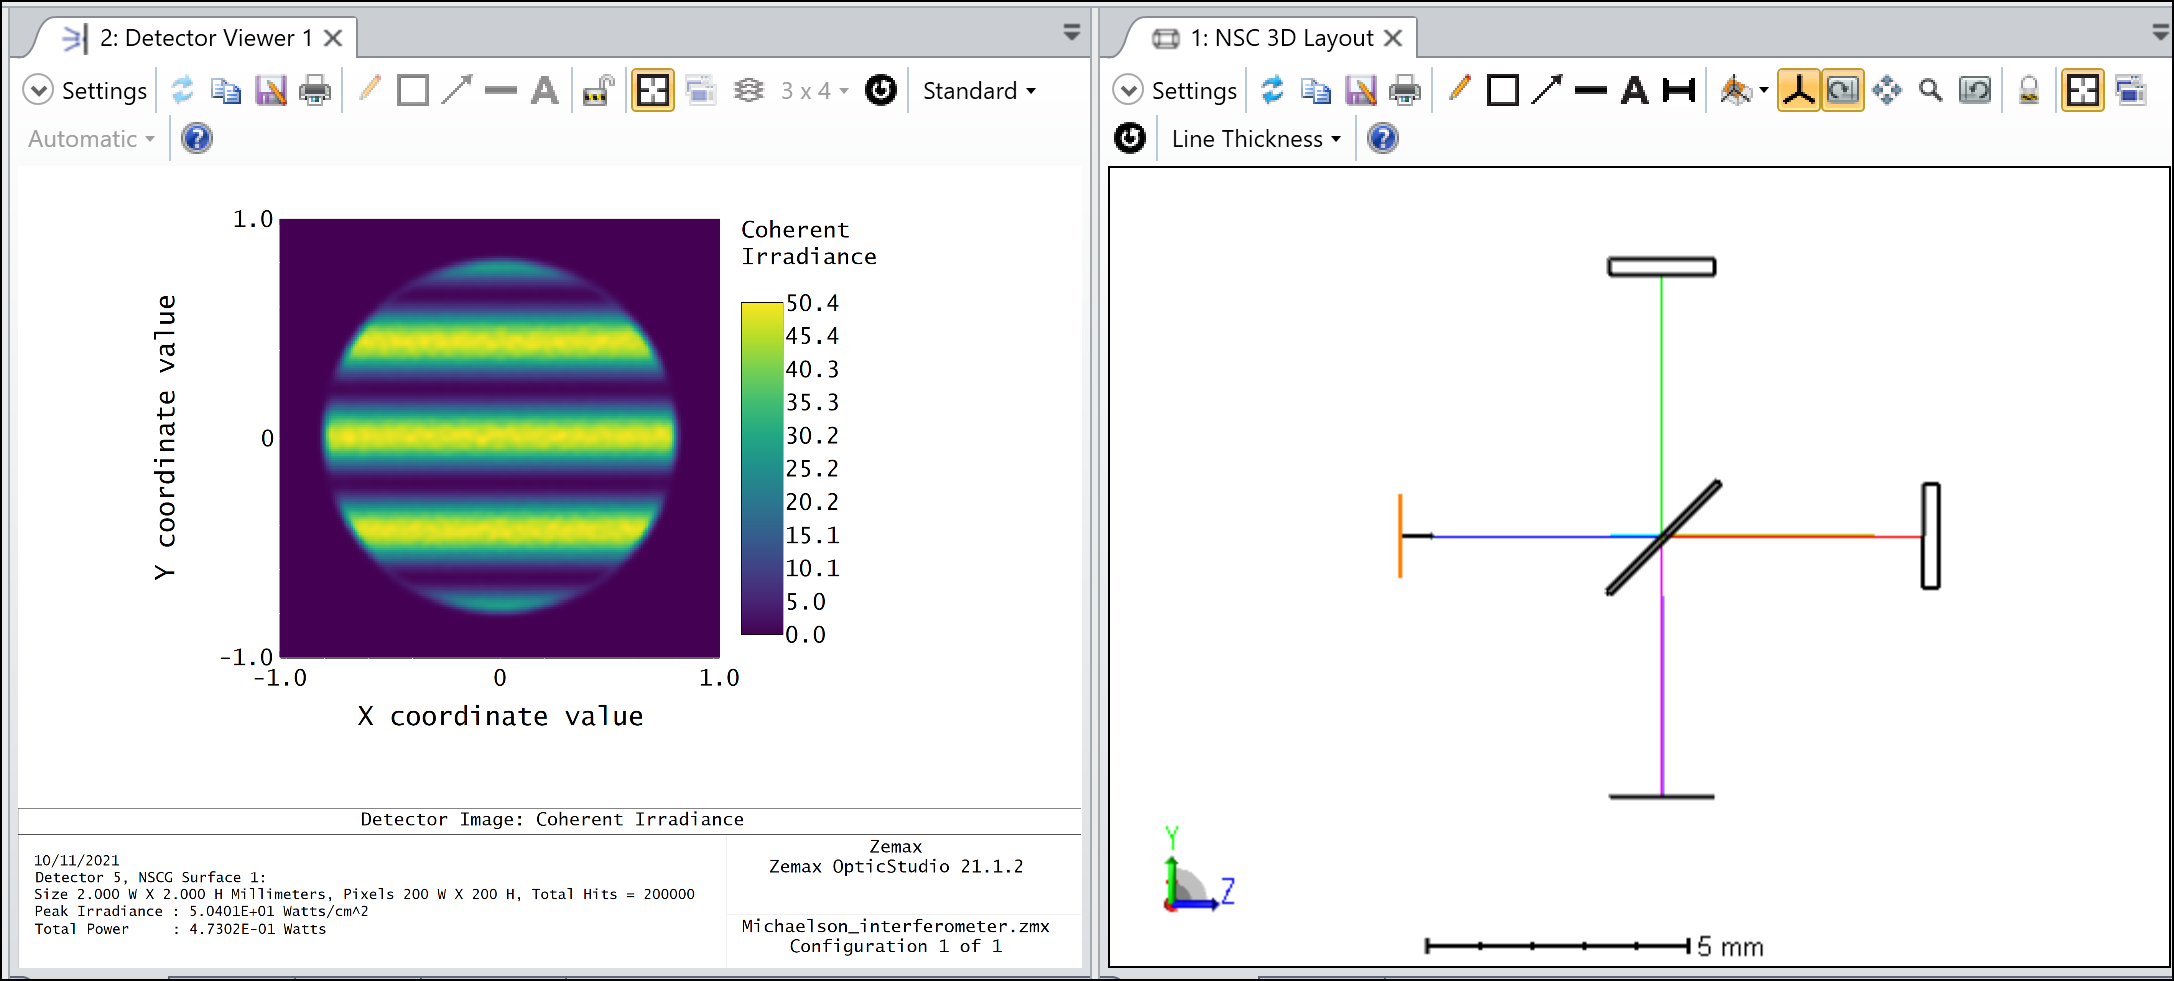
The system in the ZAR file is as below. It’s a Michaelson interferometer.


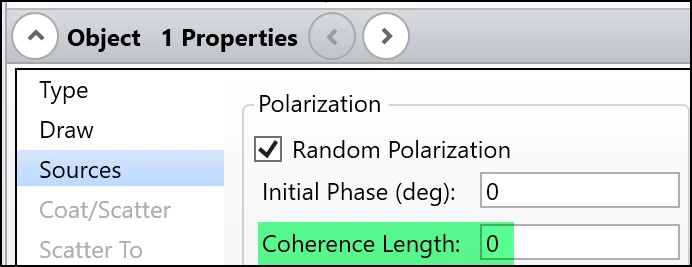
Note, in this method, we don’t use the Coherence Length settings. We just set it to zero to turn the function off.


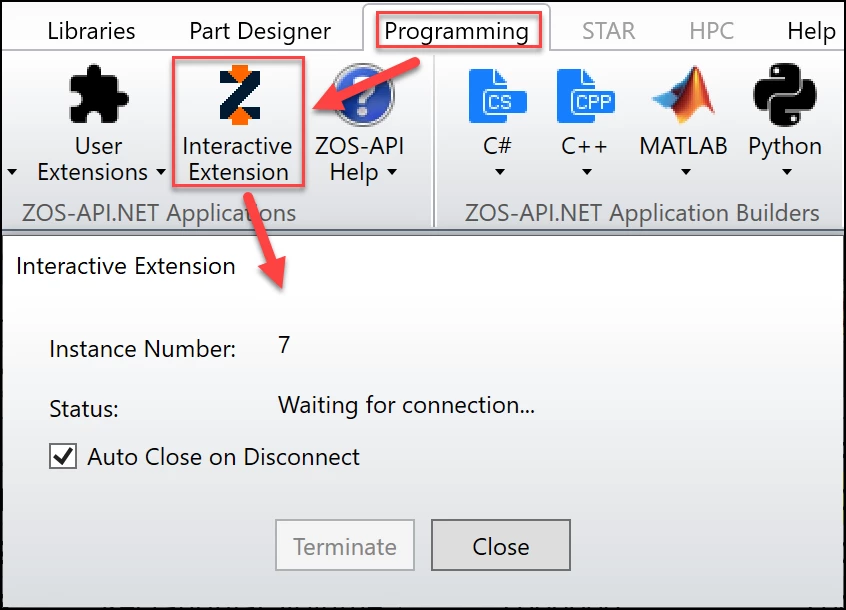
The Interactive Extension Mode can be turned on as shown below.


If you use this example code with your own system, you at least should check and modify the following 6 variables.


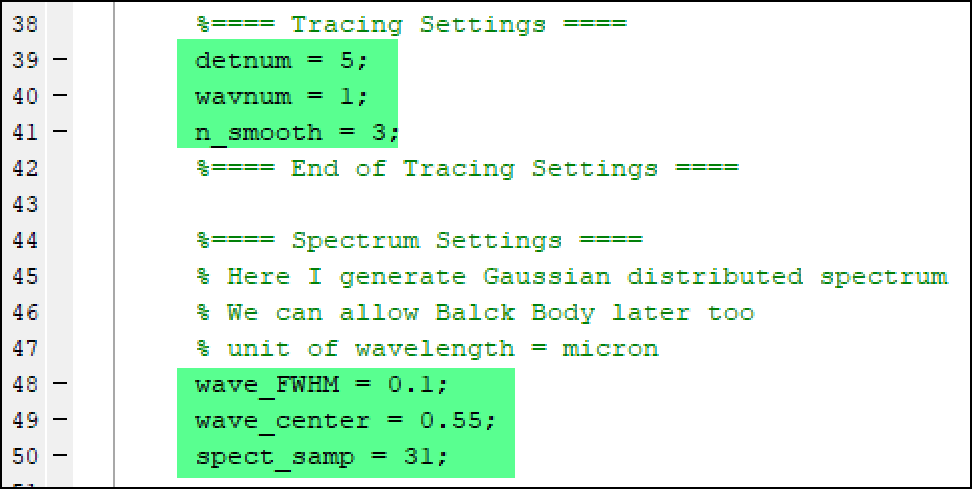
1. detnum is the object # of the Detector Rectangle you want to observe the interference pattern.

2. wavenum is the Wavenumber you used for your source parameter. It’s suggested you exactly specify this instead of leave it “0”.

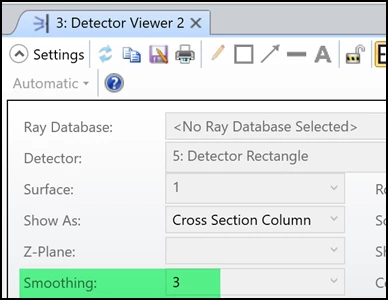
3. n_smooth works same as the Smooth parameter you see in the Detector Viewer.

4. wave_FWHM is the full width at half maximum of the Gaussian distributed source spectrum.

5. wave_center is the center of the Gaussian distributed source spectrum.

6. spect_samp is the sampling points you want to use to sample the spectrum. The more the accurate but slower the ray-tracing.


Here is the tracing result.
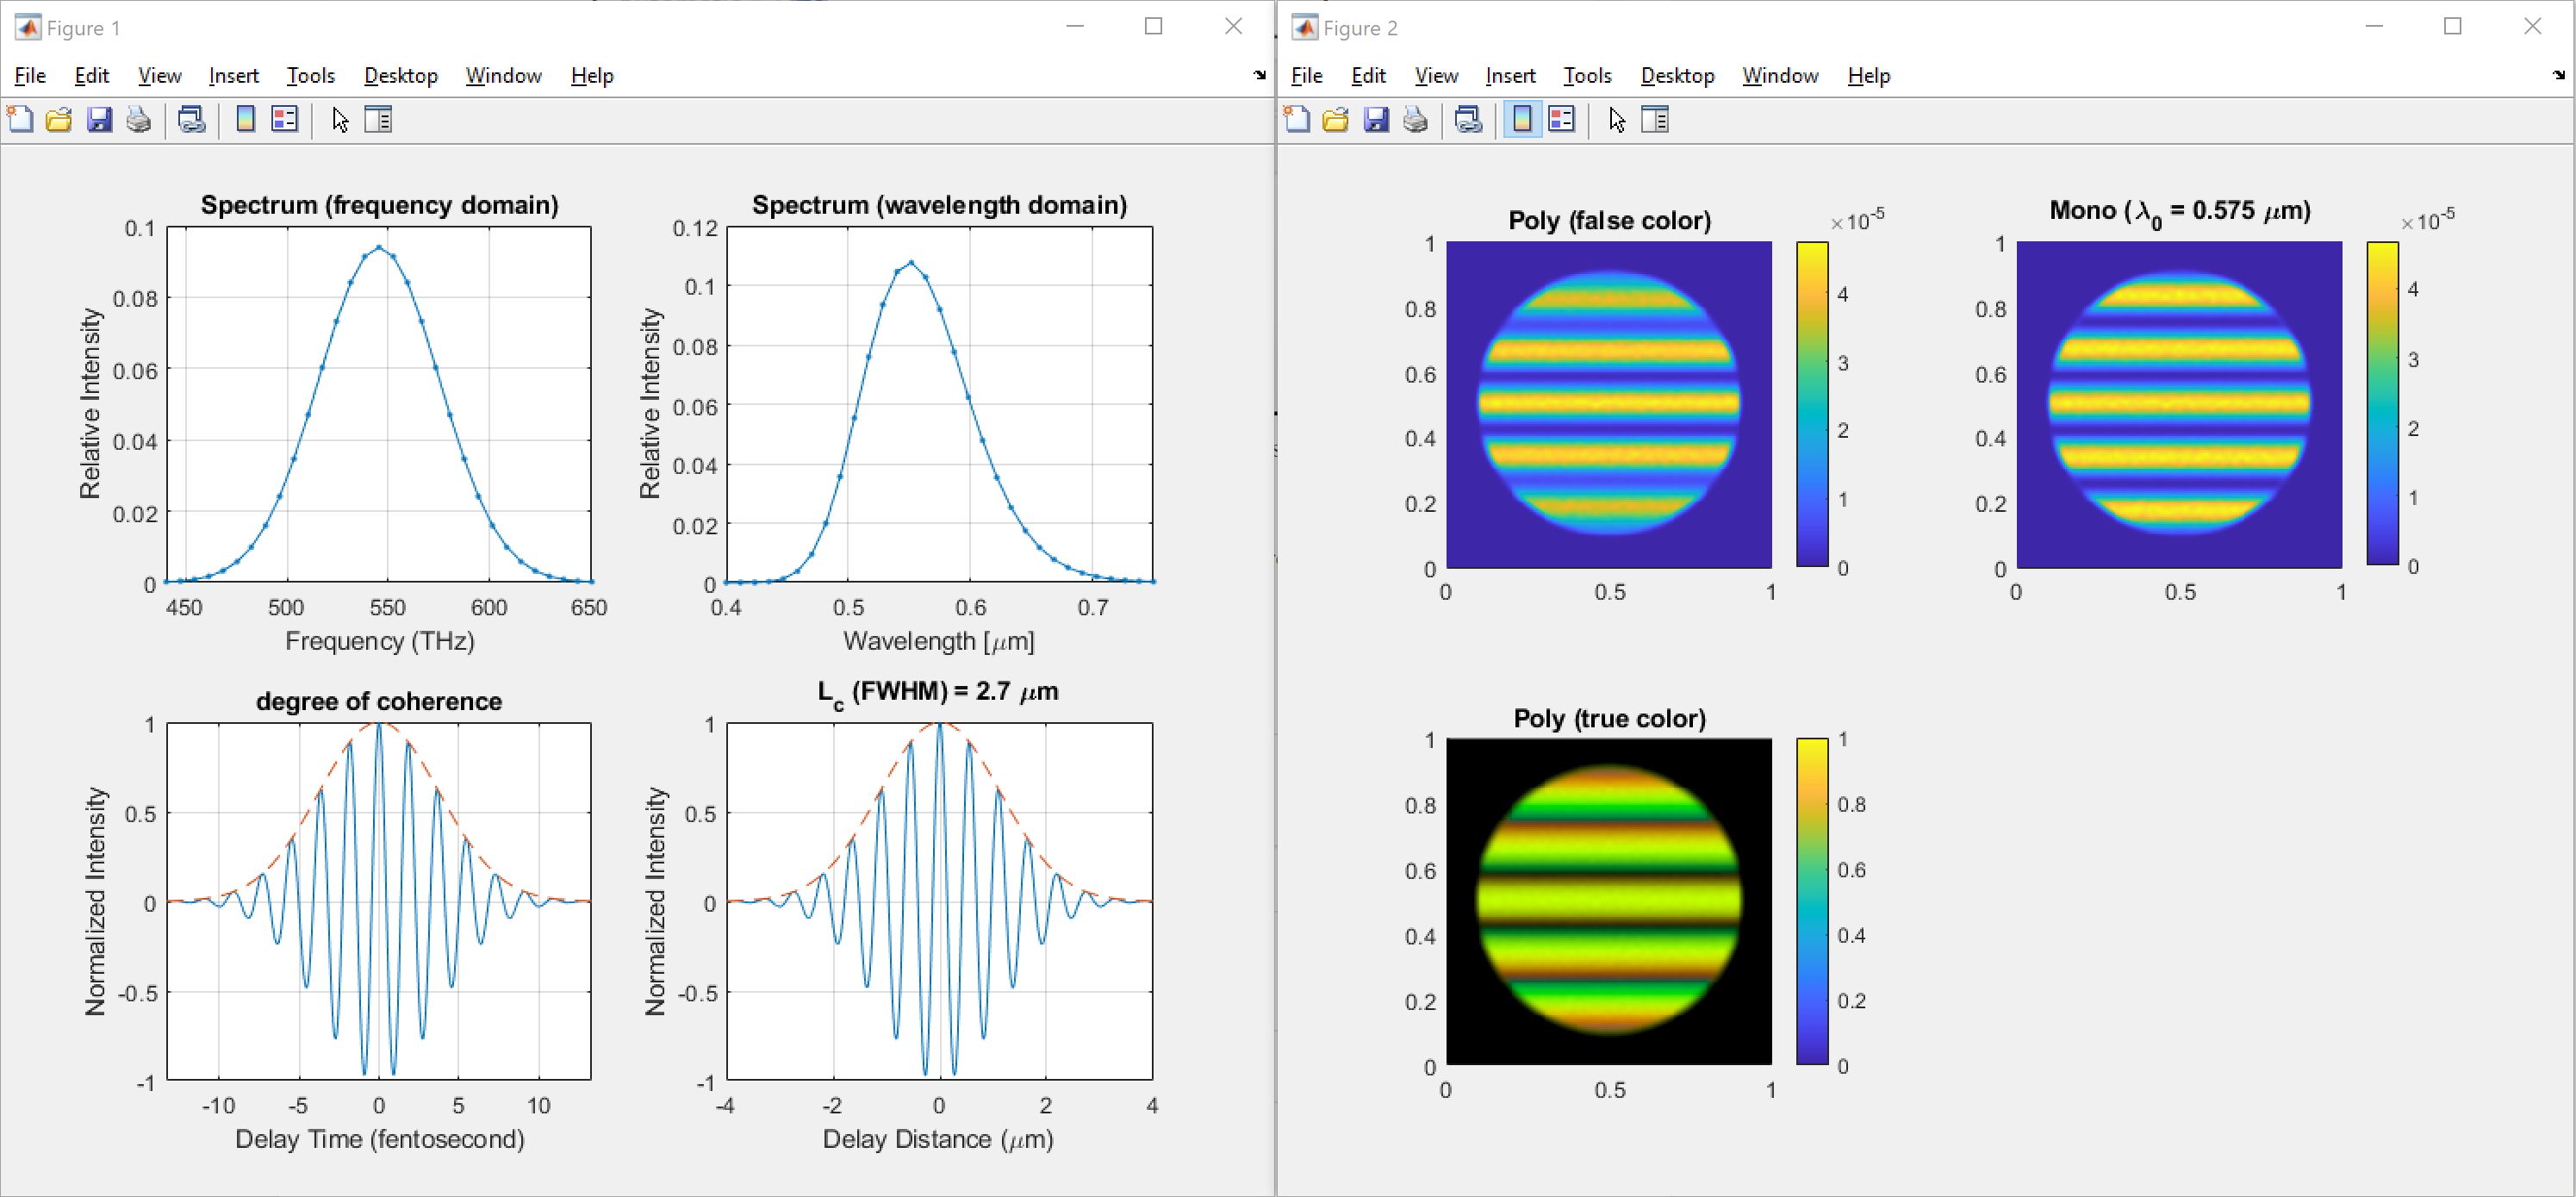
 

Enjoy it!


13 replies

Userlevel 7
Badge +3

Wow Michael, thank you for that. I haven’t played with this yet, just read your description. What is the benefit compared to the built-in method?

Userlevel 6
Badge +2

Hello Mark!


Some main difference I know is as below.

  1. More literatures support this alternative method. For example, I mainly read the following documents and made this method. I actually haven’t checked literatures for the built-in one, but I think there should be some too.

https://www.osapublishing.org/ao/abstract.cfm?uri=ao-41-25-5256 
https://www.wikiwand.com/en/White_light_interferometry 
https://en.wikipedia.org/wiki/Coherence_length 
https://m.tau.ac.il/~lab3/OPTICFIBERS/Coherence%20and%20Fringe.pdf 
https://uomustansiriyah.edu.iq/media/lectures/6/6_2020_06_06!03_01_25_AM.pdf 
https://www.osapublishing.org/abstract.cfm?uri=FiO-2006-JWD39 
https://spie.org/Publications/Book/883971?SSO=1 
https://www.iap.uni-jena.de/iapmedia/de/Lecture/Physical+Optics1535752800/PO18_Physical+optics+6+Coherence.pdf 

  1. The built-in method consider a uniform distributed spectrum and this method use Gaussian distribution, which is more realistic for a laser source.
  2. The random method used by built-in method usually gives noisy result. This method, although sometimes high sampling to wavelength spectrum is needed, gives better image with fewer noise.

Let me know if you have any more questions! :)

Userlevel 7
Badge +3

That’s really helpful, thank you

Userlevel 3

How does the original method work? There isn’t much in the manual. 

It looks like the only difference is that the original method assumed a rect, and the new one is Gaussian.  


Thanks 

Userlevel 6
Badge +2

Hi PhotonHerder,

You can find an use case of the currently coherent length feature in OpticStudio in the following KBA.:)

https://support.zemax.com/hc/en-us/articles/1500005488581-How-to-model-an-Optical-Coherence-Tomography-system

Userlevel 7
Badge +3

A similar approach can also be used to model interference with a partially coherent source:

Simulation of Young's interference experiment

Regards,

Jeff

Userlevel 3

Hi PhotonHerder,

You can find an use case of the currently coherent length feature in OpticStudio in the following KBA.:)

https://support.zemax.com/hc/en-us/articles/1500005488581-How-to-model-an-Optical-Coherence-Tomography-system

Yes but I’m asking about the difference between the modeling method built into the code and your custom one.  Is it just that one is uniform (a rect function) but yours is a Gaussian?  It’s not clear if there are any other differences. 

Userlevel 3

A similar approach can also be used to model interference with a partially coherent source:

Simulation of Young's interference experiment

Regards,

Jeff

Hi Jeff,

Thanks. Ultimately what I need to do is study the spatial coherence requirements of a Michelson interferometer, illuminated with a laser which has a 1nm line width.  

I assume the technique from your Young’s double slit article is applicable?  I’ll go through it in more detail soon… 
 

Rick 

Userlevel 7
Badge +3

Hi Rick

A laser beam is typically spatially coherent.  More specifically, at any point on a transverse plane the field fluctuations may appear chaotic, due to the finite spectral bandwidth, but these field fluctuations are highly correlated with those at any other point on the plane, hence high spatial coherence.  Of course a perfectly monochromatic beam is both temporally and spatially coherent as the field fluctuations at any point in the beam are sinusoidal.

So, I assume you are interested in understanding the impact of temporal coherence (due to the laser’s finite bandwidth) on the properties of an interferogram formed with a Michelson interferometer?  With a perfectly aligned Michelson, the output is a beam with uniform contrast.  If one of the mirrors is tilted slightly, then a spatial interference pattern is formed at the output.  Not sure which configuration you are referring to?  If it’s the latter, are you interested in comparing the spatial interference pattern contrast (modulation depth) for a monochromatic laser vs one with a 1 nm bandwidth, using an interferometer with equal path length arms?   Or are you interested in varying the path length of one of the arms to see how the contrast changes (which will also depend on the laser bandwidth)?

Just trying to understand your problem better as the specific modeling approach will likely depend on the details.

Regards,

Jeff

Userlevel 3

A laser is coherent but it it can be delivered to the Michelson via a single mode fiber, or a larger MM fiber (followed by a collimating lens).  I want to know how large the fiber can be before the fringes start to degrade due to spatial coherence effects.  To start, I can ignore temporal coherence and assume a delta function linewidth. 

Userlevel 7
Badge +3

In that case, you could use an approach similar to what I did with my double-slit simulation, but your case is simpler.  It basically involves sequentially generating interference patterns, and then adding their intensities.  This is fundamentally different than the built-in approach that OpticStudio provides via a coherence length parameter.

In any event, for a MMF source having a fully-developed speckle pattern output such that the speckle changes if the fiber is perturbed by slightly bending or shaking, I would start with a point source and generate an interference pattern.  Then shift the point source a small amount, and repeat.  Next add this second intensity pattern to the first.  By continuing to do this across the fiber diameter (as opposed to moving the source point in 2-D), you should get a fairly good approximation for the resultant fringe averaged over multiple speckle patterns -- i.e., averaged over an ensemble of fiber perturbations.  This is best done using a script.  I would estimate that 11 point source locations spanning the fiber diameter would probably get the job done.  With a script you could easily try more locations with finer spatial sampling and decide what works best for you.

Regards,

Jeff

Userlevel 3

Hi Jeff,

Glad to hear your suggestion, that’s basically the approach I was thinking about. 

Cheers,

Rick

Hello!

Is there a way in Zemax to incoherently sum the PSF of a partitioned pupil aperture?


Best,

Reply