ZPL, Macro or API for Diffraction Encircle Energy caculation in multi-configuration

  • 31 January 2022
  • 20 replies
  • 297 views

Dear Zemax team,


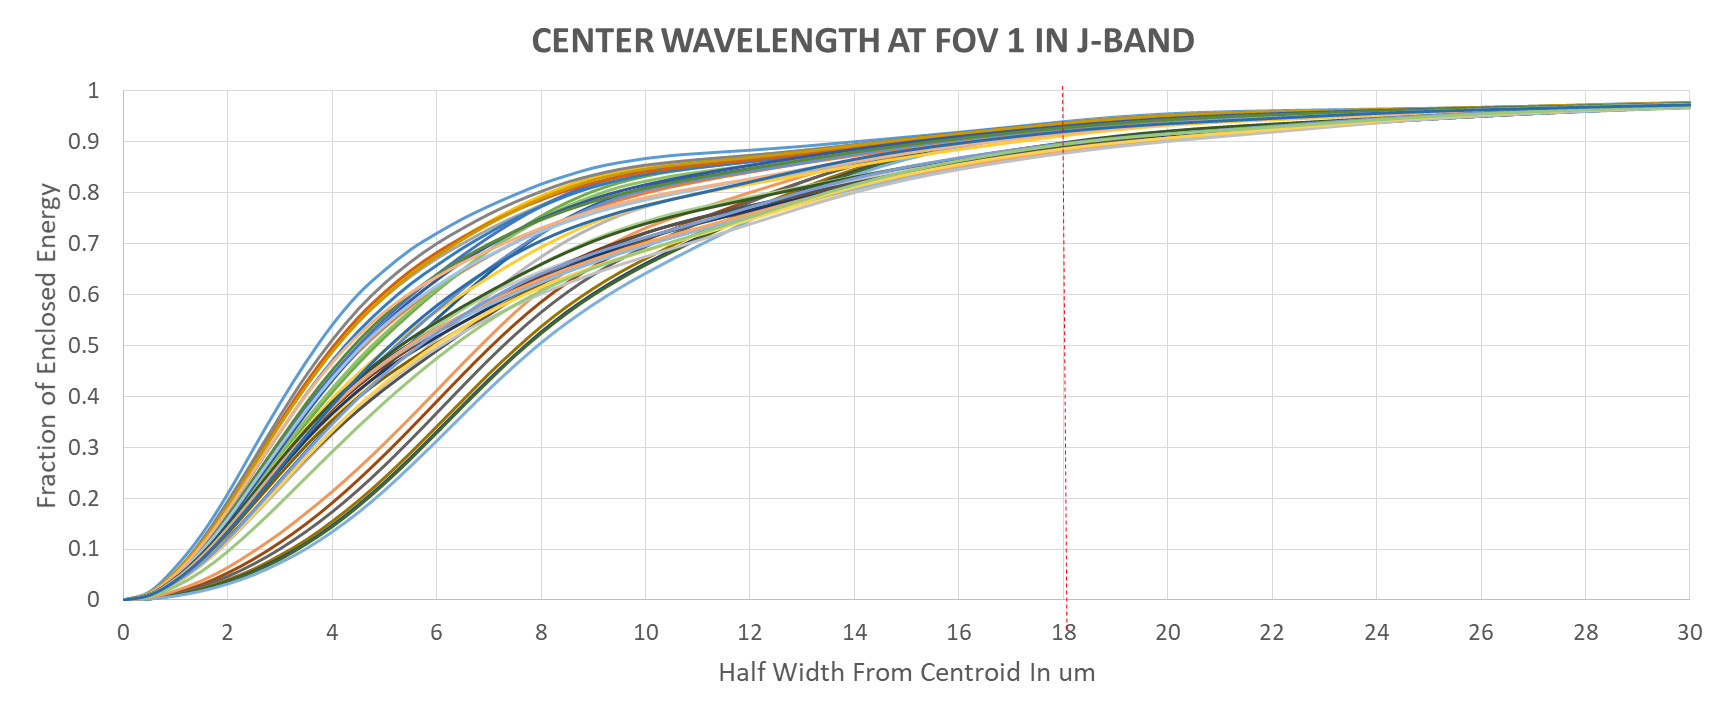
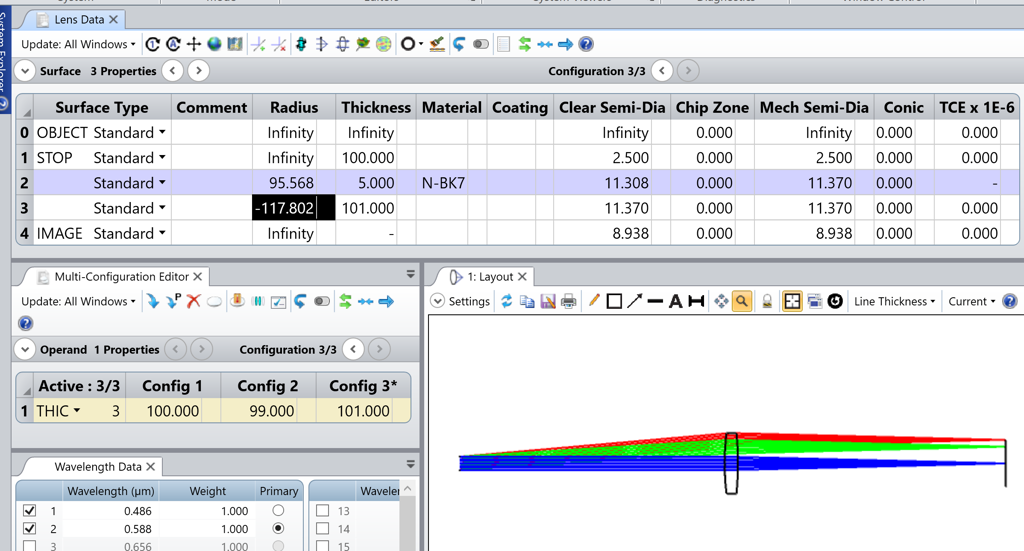
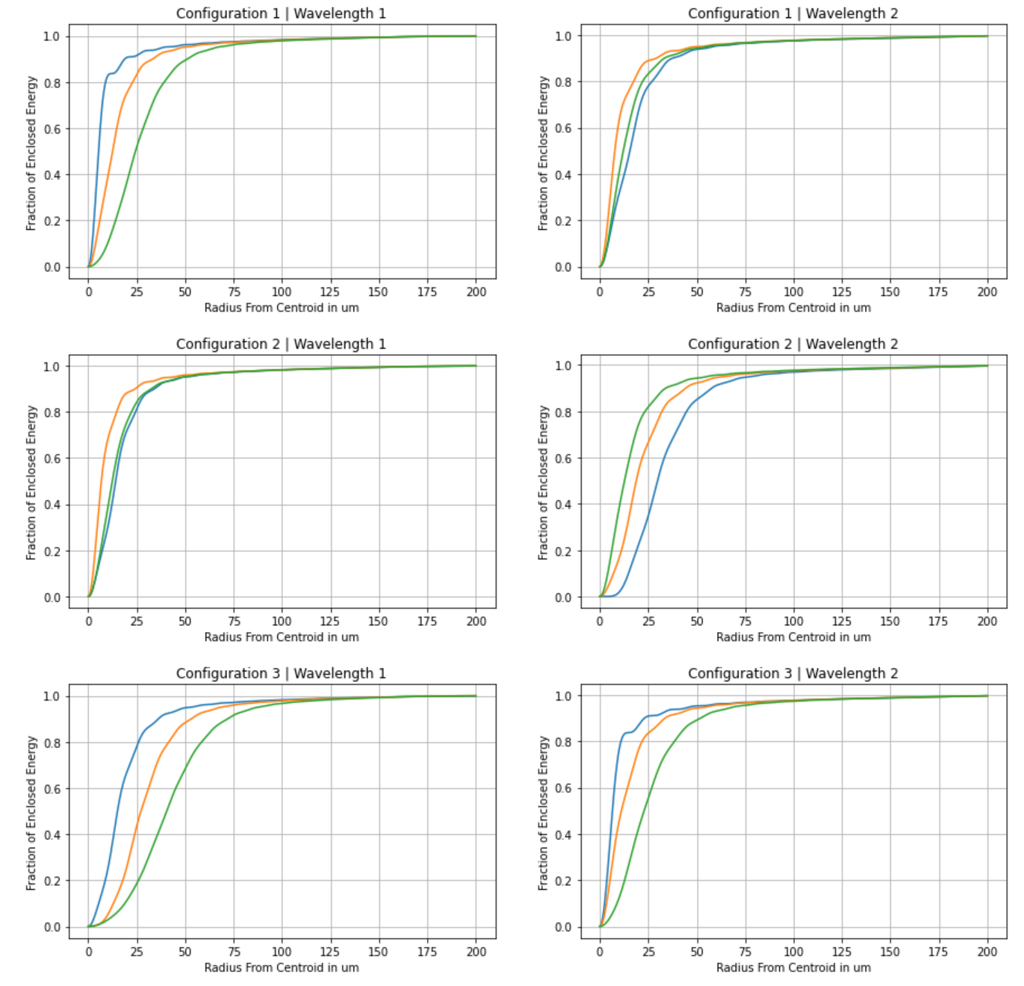
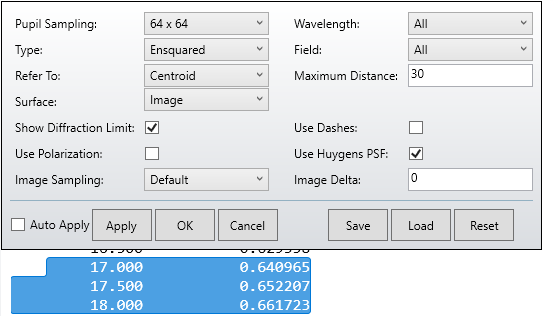
I am calculating the Diffraction Encircle Energy (DEE) in my multi-configuration file, which has 42 configurations. I want to extract the data of DEE for each configuration, and plot all of them in the same chart. What I did for now are copy, paste, and then plot all the data within an Excel spreadsheet. It cost a lot of time. Below is one figure I did for one wavelength, and I have more wavelengths and more FOVs. 


I am wondering if anyone could give me any suggestions to make this calculation automaticlly. Thanks ahead!


20 replies

Userlevel 7
Badge +2

Hi Shaojie,


Instead of a lengthy answer, I’ve written a sample Interactive Extension code in Python for you here. You shouldn’t have difficulty translating the code to any other langage. I’ve chosen the ZOS-API because the Diffraction Encircled Energy (DEE) is fully implemented in the ZOS-API. I’m also attaching an OpticStudio archive for you to try with the code. The only part you need to modify is the path where the file is saved at the end of the *.ipynb file after 

np.savetxt(...

Currently, I save it in my E:\ drive, which you might not have.

I will also attach all the documents to this post for your reference. The OpticStudio file looks like below:

And the results look like so for the three fields (in a Jupyter Notebook):

EDIT: the color-code doesn’t match, in the Python plots, blue is Field 1, orange is Field 2, and green is Field 3. But you got the idea, I hope.

Let me know if something isn’t clear.

Take care,


David

Hi David, Excellet! Thank you for the quick response! I quickly looked through the code, which should fix my problem. Thank you!


Userlevel 7
Badge +2

Hi Shaojie,


I got a notification of your answer, but somehow it doesn’t show in the thread for me. Could you upload your message again?

Take care,


David

Hi David,

No worries. I made a mistake and deleted the message. Sorry about that, but thank you for the response!

Shaojie

Userlevel 7
Badge +2

Hi Shaojie,


I thrust that you got the code working. Let me know otherwise, I’m always happy to help.

Take care,


David

Hi David,

Yes, the code works well, and thank you again!

I got a further question. There is a mismatch between the ‘Text of  DEE’ and the numbers saved by API, which can be 1-2% at some points. I guess it is probably because the setting I did is not exactly the same. The following figures show the settings.

Another question, how can I change the steps for DEE data. Saved data have very finer steps, but DEE within the text it always shows the step of 0.5. I tried to change the image sampling in DEE, but it doesn’t affect the result. 

Please advise. Thanks ahead!

Shaojie

DEE setting


Userlevel 7
Badge +2

Hi Shaojie,


I can only speculate here, and we might need to involve someone from Zemax at this point, but from what I tested:

  1.  The Text Tab of the Diffraction Encircled Energy (DEE) is always displaying 100 values and I don’t think there’s a way to change that (perhaps normal?)
  2. The DataSeries from the ZOS-API seem to always return 400 values and is independant of the HuygensDelta, which is called Image Delta in the analysis. I find this weird for two reasons. First I was expecting that if my maximum radius is 50 and I choose an image delta of 1, then I would get 50 samples. This is not the case, I get 400. And also, I find it strange that in the ZOS-API the Image Delta is called Huygens Delta. Could there be a bug?

Based on the above, I suspect OpticStudio needs to interpolate the values it displays in the Text Tab, and in doing so, depending on the settings of your analysis it might be a little bit off. However, when I tested on my end I did not notice the 1-2% difference, it was always on point. But I can’t be sure that this is what’s happening to you, would you be able to share a simple example that illustrates the 1-2% difference?

I’d say if someone like @Sandrine Auriol could have a look at this as well it might be helpful.

Take care,


David


Hi David,

Thanks for the quick response. I just checked more points again carefully, which have some mismatch, but it is not as large as 1-2%. Since the two formats have different steps, it is not very direct to compare the results. It makes more sence that they agree with each other, and I don’t need to verify which data is accurate.

Yeah, if anyone in Zemax can help with step setting, it will be great.

Thanks,

Shaojie


Userlevel 6
Badge +2

Hi Shaojie, Hi David

About the steps, I don’t think that you can change it. It is fixed within the software. If you need a specific step, I suppose the only way (but not very efficient) would be to use the DENF operand. In the API, you can read the operand value without the operand being actually defined in the merit function.

For the accuracy between the API and the Text tab, I did a test on the "{Zemax}\Samples\Sequential\Objectives\Cooke 40 degree field.zos" file. The values match between the Text tab and the API. I tried with these settings and I have attached my excel results:


The ImageDelta is the same as the HuygensDelta. I checked and it works as the ImageDelta in the Diffraction Encircled Energy analysis. I’m not sure why it has a different name. I would report it to our developers.

I hope it helps.

Hi Sandrine,

Sure, this is helpful! I will take your suggestion for the step setting to meet my analysis.

Regards,

Shaojie

Userlevel 7
Badge +2

Thanks for your comments @Sandrine Auriol. Out of curiosity, what does the Image Delta changes if its not the sampling of the analysis window, which seems to always be 100 samples. Or is it taking 50 samples, but then showing 100 by interpolating in between?

Take care,


David

Userlevel 6
Badge +2

Hey @David.Nguyen! The Image Delta changes the sampling of the PSF on the image plane (it is a spacing in um). 

Userlevel 7
Badge +2

That’s right, but if, for example, I set the Maximum Radius to 50 um, and I use an Image Delta of 1 um it means I should get 50 samples, is that right? In the Text Tab, it is still showing 100 values, if I’m not mistaken. Therefore, I was wondering how the values are calculated, is it a linear interpolation between the 50 samples?

Userlevel 6
Badge +2

Sorry I see, good point. I’ll check as I don’t know that.

Userlevel 7
Badge +2

Thanks a lot and by the way the same applies to the ZOS-API DEE. It still returns 400 samples instead of the 50, hopefully it uses the same method to calculate those samples.

Take care,


David

Userlevel 6
Badge +2

Hi David and Shaojie

Csilla has helped me on this subject and we also contacted our developers. We continued our testing too with the Cooke Triplet sample file. Here are our findings:

  • In the Text tab of the Diffraction Encircled Energy (DEE), we don’t always have exactly 100 values. The number of values depends on the Maximum Distance setting. 
    For example in the Cooke Triplet, for Maximum Distance =  40 we get 81 values, for Maximum Distance =  50 we get 101 values, and for Maximum Distance =  60 we get 121 values. 
  • The Image Delta setting in the analysis is the point spacing of the underlying PSF image grid in micrometers. It is not the spacing for the Encircled Energy analysis. An interpolation is performed for the Encircled Energy analysis in the background. 
  • Even though the API names the image delta as “HuygensDelta”, this value is the Image Delta and it is used for both FFT and Huygen’s version of the calculation.

  • In the API, the output for the enclosed energy calculations is always set to be 400 points even though the grid size may not match up with that number. The data is interpolated at the 400 evenly-spaced points before being output to the screen.

I hope it helps. But let us know if you have any further questions.

Userlevel 7
Badge +2

Hi Sandrine,


Thank you for your message and answer. Thank you to @Csilla Timar-Fulep as well.

Could you confirm whether this is a linear interpolation or something else?

Take care,


David

Userlevel 6
Badge +2

Hi David

The interpolation is a cubic spline. 

Have a nice Friday!

Userlevel 7
Badge +2

Thank you @Sandrine Auriol, nice Friday to you too, and a good weekend.

Take care,


David

Reply