Hi Christoph,
The FFT PSF computation is done in pupil space coordinates while the Huygens PSF computation is done in image space coordinates. What this means is when using the FFT, rotating the image surface will have no effect on the orientation of the computed PSF. The X and Y orientation corresponds to the X and Y orientation in the entrance pupil.
So, the Huygen's orientation will be local to the image plane but the FFT will be local to the entrance pupil.
As far as the orinetation of the matrix data, the top left intensity value will correspond to the top left of the PSF plot and the bottom right will correspond with the bottom right of the PSF plot.
Best,
Kaleb
The Zemax PSF (Huygens as well as FFT) is displayed in the Coordinate System (X-Position, YPosition)
This Coordinate System (CS) is identical to the local CS in the image plain, right?
No! There is a very important distinction between the coordinate systems of the Huygens and FFT PSFs. See the online help for the FFT PSF for full details, but in brief:
The Huygens PSF is computed in the image plane, as you say above.
The FFT PSF is computed on an imaginary plane which is centered on and lies perpendicular to the incident chief ray. Because the imaginary plane lies normal to the chief ray, and not the image surface, the FFT PSF computes overly optimistic (a smaller PSF) results when the chief ray angle of incidence is not zero.
The FFT PSF is the FFT of the wavefront in the exit pupil, and so the computation is done in pupil space coordinates and scaled to the image surface size. So, rotating the image surface will have no effect on the orientation of the computed PSF. The X and Y orientation of the FFT PSF corresponds to the X and Y orientation of rays in the entrance pupil, which is not always the same as the spatial X and Y orientation of the image.
To compute the PSF in the image space coordinates, use the Huygens PSF.
The text data is listed in the same order as drawn in the false color and similar plots:
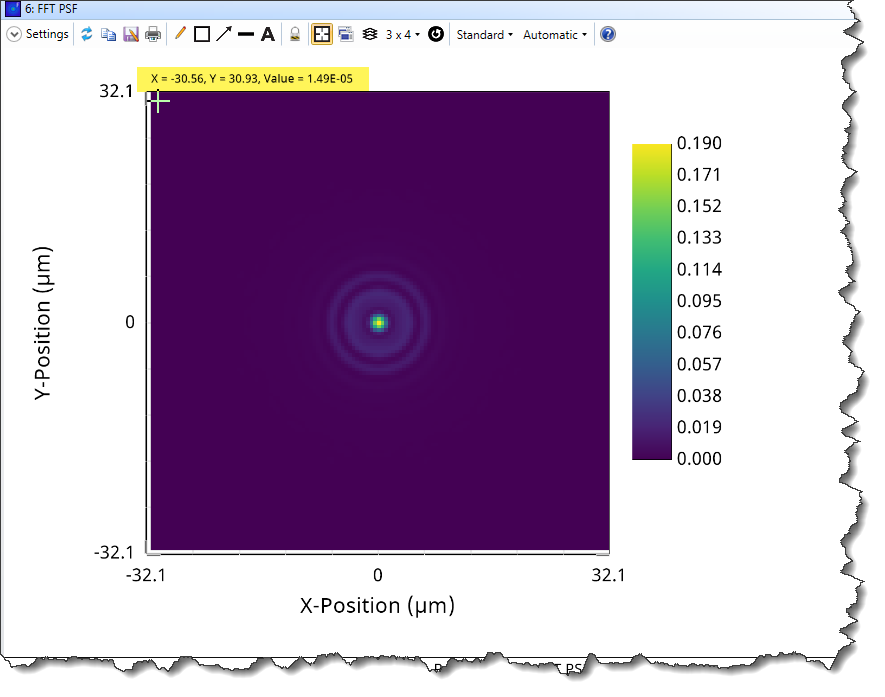
Sorry to use so much bold text, but there are some important if subtle distinctions between these two PSFs that are not always grasped. If there are any differences, trust the Huygens PSF, it is the gold standard of ray-based calculations.
- Mark
Sorry Kaleb, we just posted the same reply at the same time!
Thank you for these very clear explanations!
I just got back from vacation.
Hi Kaleb and Mark,
After returning from vacation I tried it.
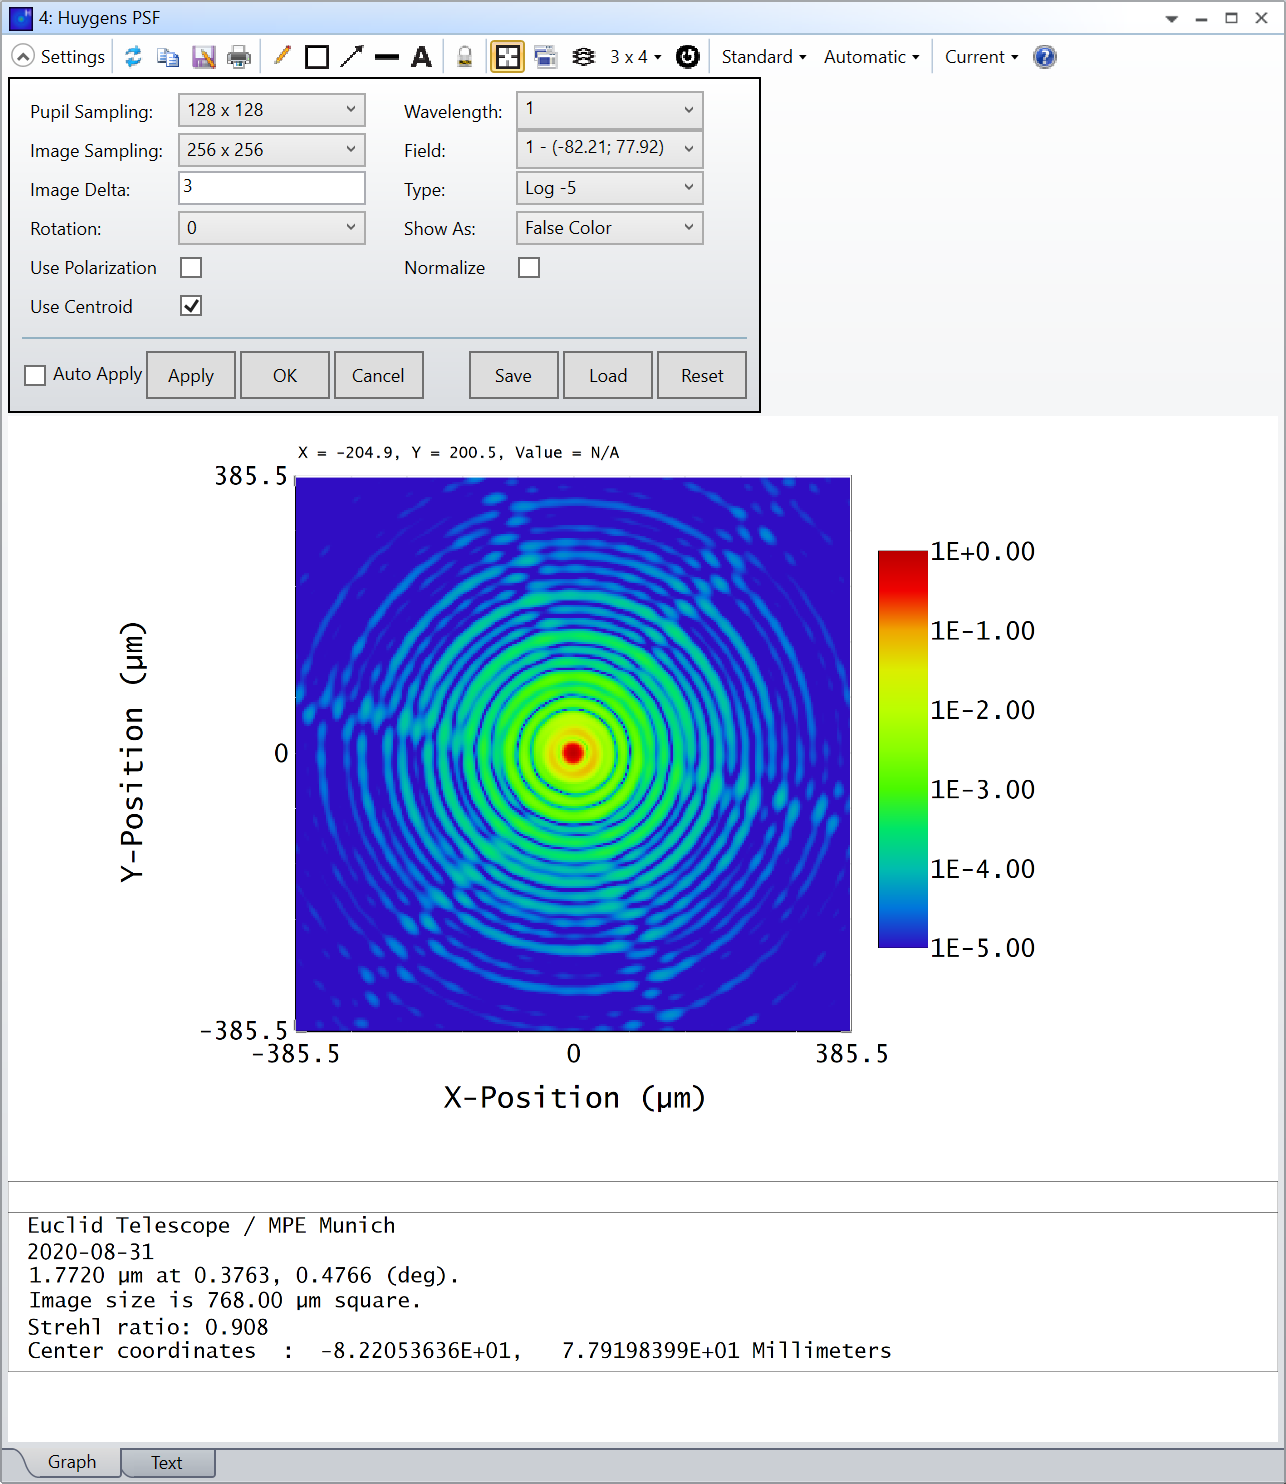
First of all, the display which is shown at the left top of the plot window and should show the data at the curser position, shows 'N/A' for a large data range in the top left region of the plot, see the attached screen shot. Can you confirm this issue? What is happening?
Second, with the data that is displayed, I found a different link between the data matrix and the plot:
The columns of data are linked to the x-direction and the rows are linked to the y-direction.
Therefore, the first number in the data matrix (first row, first column) is the lower left of the plot (-x,-y)
And the last number (last row, last column) is the upper right of the plot. (+x,+y)
So can you confirm this?
Best, Christof.
Hello Christoph,
There is currently a bug that will show the N/A values on the 2D plots. Our developers are currently working on a fix, and I apologize for the inconvenience on that.
As for the display of the data, I found a PSF that was non symmetric and took the data direct into excel. After using conditional formatting, I can confirm that the data in the text tab matches the position of the graph.
Would you mind opening a case in MyZemax and sharing your file so I could test on my machine?
-Kaleb
Hi Kaleb,
thank you for this additional test. I checked it again and... I can confirm it is correct. So the link is exactly as you sad above, which is also the most straight forwod relation.
It is a miracle to me, that yesterday I found a different relation. I have no idea how this happened. I tested it several times.
Sorry for the confusion and thanks for your patience .
Christof.