Solved

Source Diode with circular aperture

  • 8 December 2020
  • 29 replies
  • 948 views

Userlevel 1

Hello,


I need for my simulation source diode with circular instead of rectangular aperture (without the possibility to model arrays).

Thus I would like to know if the DLL code of source diode is available, so that I can manipulate it for my purposes.


Thanks and best regards


Dirk 

icon

Best answer by Berta.Bernad 9 December 2020, 13:19

View original

29 replies

Userlevel 3
Badge +2

Hello Dirk,


Most of the sources that are used in OpticStudio are not DLLs, so the diode source code is not available.


However, if you have data  that you would like to implement, you can write such a DLL yourself. Although the diode is not available, there are several types of source DLLs that come with OpticStudio that can seve as a template in the folder \DLL\Sources.


The help file The Setup Tab > Editors Group (Setup Tab) > Non-sequential Component Editor > Non-sequential Sources > Source DLL contains more information on this topic, as well as this article .


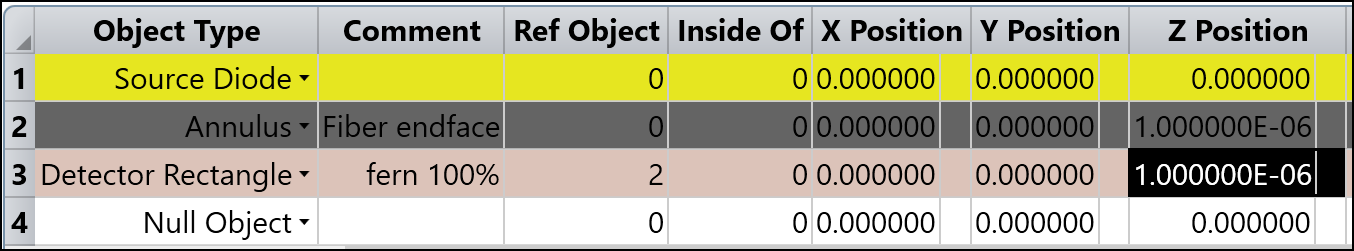
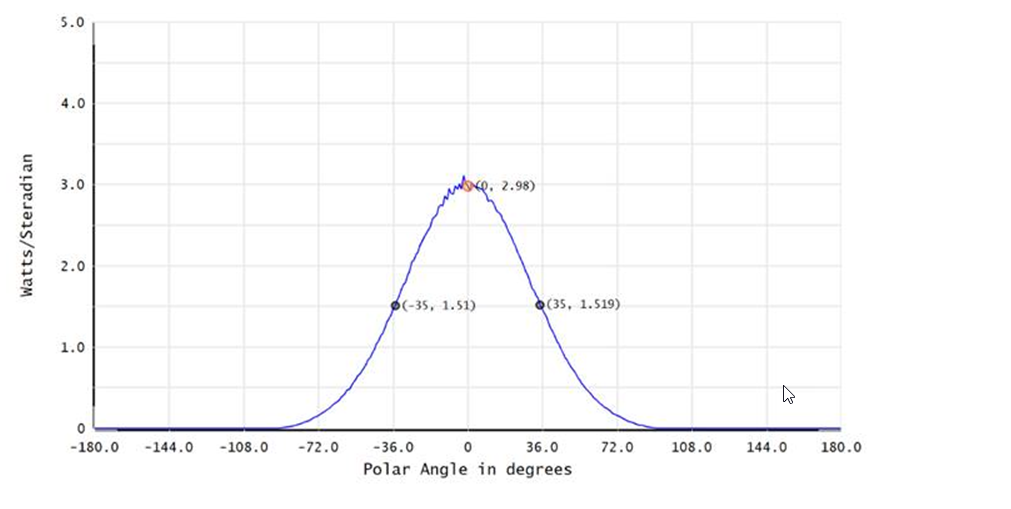
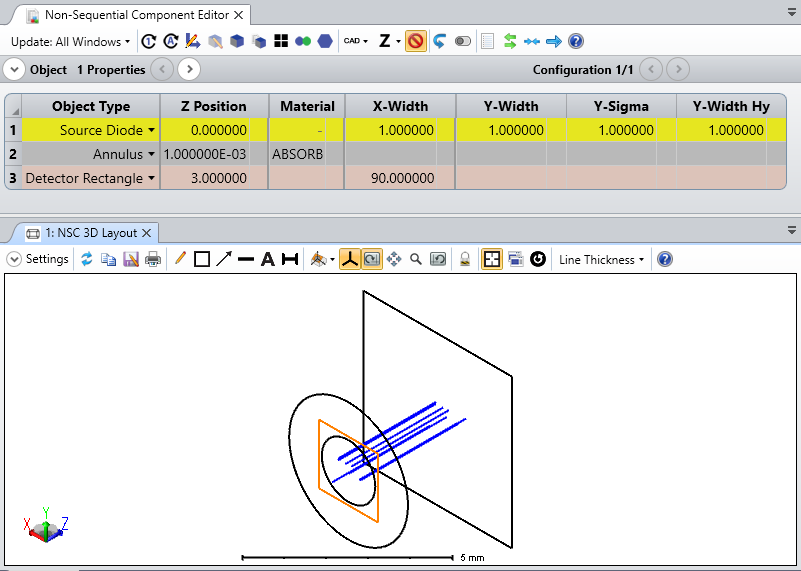
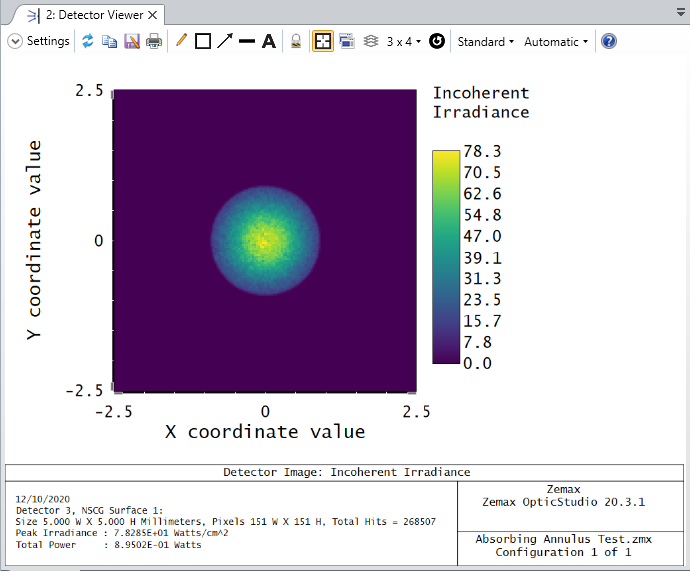
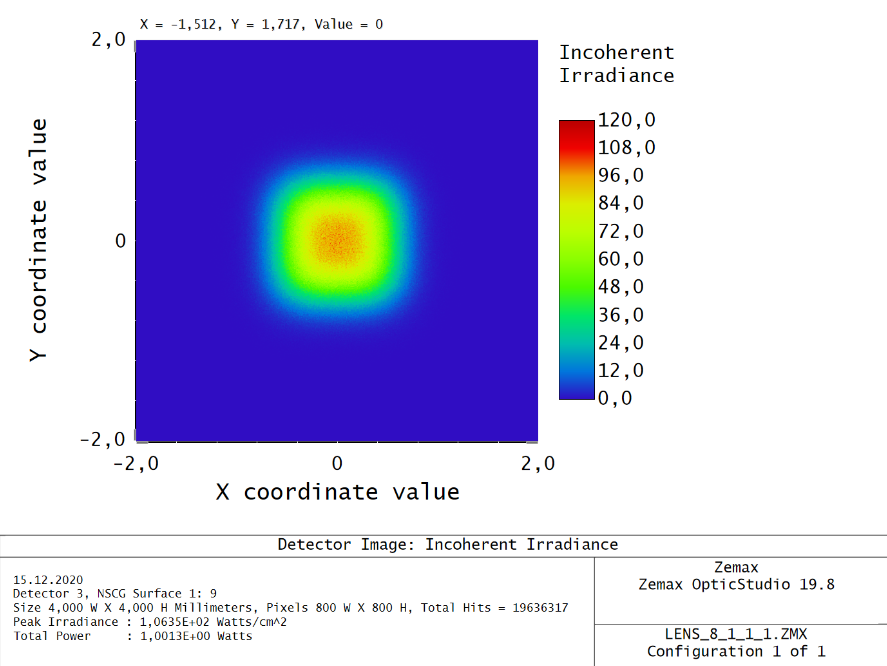
Alternatively, you may use Source Diode with an Annulus object to block the unwanted emitting area so that the aperture is circular.


Best,


Berta


Userlevel 1

Hello Berta,


thanks for your answer. Actually I was using Source Diode with annulus very close to the source (1 micron distance).

But I can still see a weak rectangular shape of the intensity distribution on a detector in the near field. And if I further reduce the distance, Optic Studio provides error messages. So this seems to be a good first workaround but does not work 100% properly...


I have read the Optic Studio manual (p. 494 ff), read the acrticle you recommended, also the help file. And I had a first look into the code of Fiber1.cpp. It looks like DLL programming will take some time, because it's the first time I do it. Can you recommend some more detailed description about Source DLL programming? Or do you know what to do allowing me to put the annulus closer than 1 um to the Source Diode?


Thanks and best wishes


Dirk


Userlevel 5
Badge +1

Hi Dirk!


Thanks for your follow-up here. Without being able to see your file, it's hard to say why exactly the distribution of light in your near field detector remains rectangular despite having an absorbing annulus object. One thing you might want to check is that the X-/Y-Width are defined to have the boundaries of the Source Diode itself completely covered by the Annulus object's absorbing area. Depending on the placement of the objects, it might be that the annulus is being ignored, but again, this is hard to say without seeing your file. To demonstrate, though, I've attached a file where the output near field distribution is circular rather than rectangular:


201210-123917-image.png


201210-124003-image.png


If your file still shows some inconsistency, you could certainly share that in this thread or as a new MyZemax case for us to make more specific comments!


As for other resources that cover DLL creation, I think this article does a nice job summarizing all of the key elements that each DLL requires to properly run. Though it covers all different DLL types (Surface DLL, Source DLL, etc.), the link should directly take you to the Source DLL section. After this article, though, we do recommend looking at some provided sample DLLs and their source code (when provided) to get a more in-depth look at the structure of the code.


Let us know how these thoughts work out for you, and thanks again for the discussion so far!


~ Angel


Dear Dirk, Angel and friends


First of all, I apologize for using your post for my consultation. I am working on the thesis project, and for the design I need the simulation of a 365nm photodiode. However, simulation is not my branch and I am very difficult to process in OpticStudio. In summary, what they would need to obtain is the graphical relationship between the radiance or intensity of the diode according to the distance at which the receiving surface is located.


Blessing,


Oscar

Userlevel 1

Hello Angel,


thanks again for your support:-)


Regarding my problem I attached the zar file. As you can see, the size of the source is 400 um x 400 um .

The annulus has a clear aperture diameter of 200 um. Both, source and annulus, are arranged concentrically and have 1 um distance.

The detector is placed about 5 mm behind the annulus and you can still see the rectangular shape of the source in the (incoherent) 2d-intensity profile (100E+6 analysis rays).


One workaround would probably be to make the source larger. But then I am absorbing even more analysis rays. Even now I am absorbing about (1-pi/(4*4))=80% of all the analysis rays, which is not very efficient.


Best regards

Dirk


Userlevel 4
Badge +1

Hello everyone,


The issue here is that you have an X and Y Supergaussian function that is not 1. This means that you are defining X and Y angular spreads that do not sum to a circular pattern. From the help file on Source Diodes, we see that:


The Gx and Gy are your Supergaussian terms. If they are 1, then the term inside the outer parentheses is in the form X^2+Y^2, which we know defines an R^2 of a circle in whatever space you are working in, in this case in angular space. The intensity will follow this circular distribution of angles, but changing the 1.0 to anything else distorts it, with higher numbers becoming increasingly square-like. The below is what I got by making this single change:


Cheers,


Kevin Scales

Userlevel 1

Hi Kevin,


...this is interesting. Thanks!

Can you explain how the angles theta_x and theta_y are defined?

Maybe I am blind, but I could neither find an explanation in the manual nor in the help file... 

Are those the angles between the ray vector and the x-coordinate axis / the y-coordinate axis?

Or are those the direction cosine values with these coordinate axis? 

And what is the definition range of theta_x and theta_y?  [0, 180°]?


Thanks and best regards


Dirk


Userlevel 1

By the way:


I ask myself if source diode is a good model for a diode.

From my knowledge most of the 2d-intensity profiles from diodes have a circular shape in the farfield, even if the light emitting

surface has a rectangular shape. 

If I do not choose Gx=Gy=1 I do not get a rotationally symmetric 2d-intensity profile in the farfield.

Just take Gx=Gy=0.3 and have a look on the 2d-intensity profile:


This does not really make sense to me...


What I would like to have is a source model with circular light emitting surface and an rotationally symmetric

2d-intensity profile in the farfield, with the possibility to parameterize the shape of this rotationally symmetric 2d-intensity profile.

Additionally I would like to define dP/dA as a function of x and y on the light emitting surface. 


Best regards


Dirk


Userlevel 4
Badge +1

Hi Dirk,


The thetas are the actual angle for a given ray. That formula for I that I posted is a distribution, so it is giving you a relative number of rays that go out at a given angle thetaX and thetaY with respect to the local Z axis. It is a probability distribution in this sense. To know what fraction go off in that direction, plug those values into the formula. Other factors include the parameters alpha X and Y and G X and Y, which you also provide. alpha X and Y are the overall spreads, which you provide (as 8.3 for your system) and the G values, which I explained earlier. The theta values are capped at forward directions, so 90, though putting a larger number in won't cause an error. It will simply not exceed 90.


For far fields, you mainly will want to look at the angular distribution, as even a square source will present a mainly circular beam for G values of 1. The G's determine the distribution of the ray angles from the source. However, the H values, mentioned further down, define the distribution of the ray source locations on the source. The source will physically always be a square object, but the distribution of rays on that object can be made more circular by changing the s X and Y and G X and Y values. The sx and sy define a Gaussian width, so there won't be a hard edge. If you set it to about .1 and put the detector very close to the source, like .001, you can see a circular pattern on the ray location distribution. But to have a uniform distribution on the circle, you will still want to have a large value and then put an annulus over the source. In the far field this won't matter, as the angular distribution will dominate, but for near field this is how you would do it.

Userlevel 1

Hi Kevin,


thanks a lot for your explanation.


1. Can you tell me in which cases Gx,Gy ≠ 1 would make sense? I do not know a diode which has a noncircular / nonelliptical 2d-intensity distribution in the farfield.


2. Which workaround do you propose for the following simulation task:


-Source with circular aperture and constant dP/dA over the aperture

-Rotationally symmetric 2d-intensity distribution in the farfield

-Possibility to change width w and (!) shape v of the rotationally symmetric 2d-intensity profile you get    on a rectangular detector in the farfield:  


  I(r) = I0 * exp(-2 * (r/w)^v )


 (Note: in my formula you get a 'real gaussian' intensity profile if v=2. Variable r is polar coordinate of  the rotationally symmetric int. profile)


Thanks and best regards


Dirk


Note:


You can see here:

https://www.rp-photonics.com/flat_top_beams.html


also here:

https://arxiv.org/pdf/1510.07708.pdf


how a supergaussian beam is defined correctly.

From my point of fiew the wording 'supergaussian factor G'  which uses Optic Studio in case of Source Diode parameter G is misleading.... 


Userlevel 1

Hi Kevin,


to be honest I do not believe that theta_x and theta_y are the angles between the ray vector and the coordinate axis.

I made a simple calculation to check this:


I used your angle definition and made a parametric 3d-Plot of the ray vectors, assuming that

theta_x² + theta_y² = constant:


When you now make a 3d parametric plot of e-vector, with theta_x as parameter, you do not get a circle. So for me it looks like this does not model a rotationally symmetric ray distribution. 


But....

if I do the same but assuming that cos²(theta_x) + cos²(theta_y) = constant 

....then ....tatarata....I get a circle as parametric 3d-plot.


So it looks like   
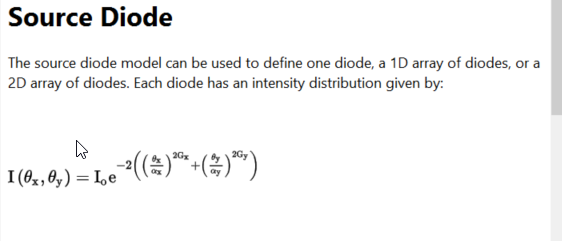
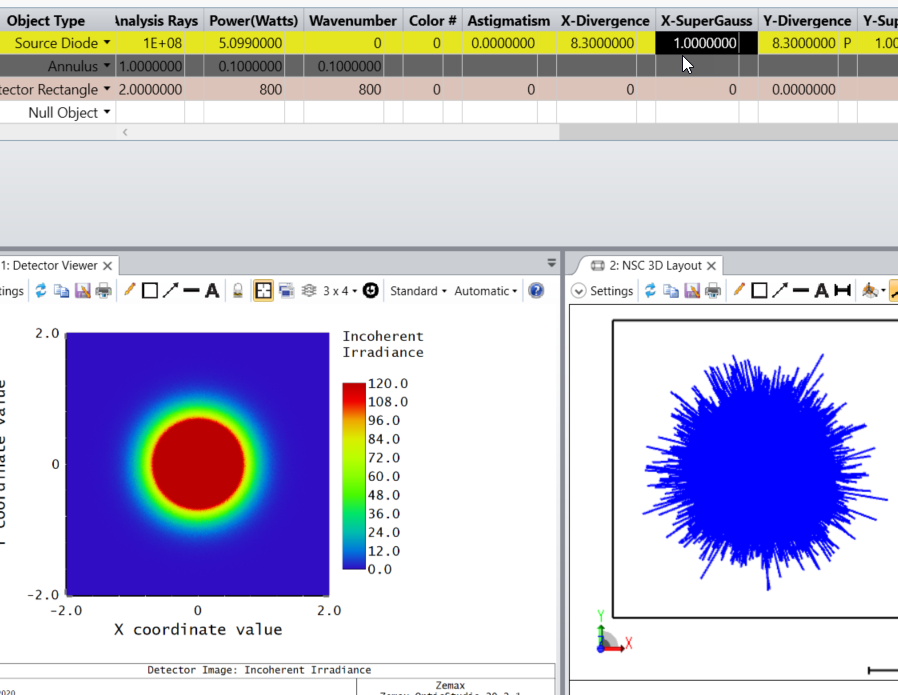
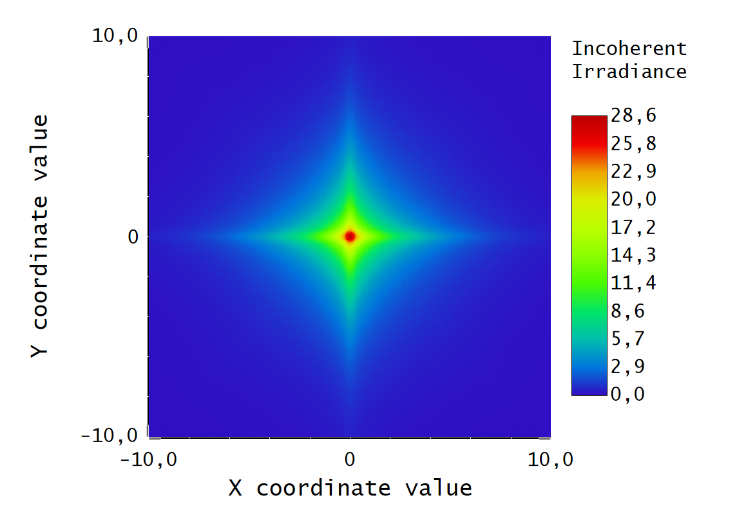
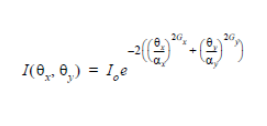
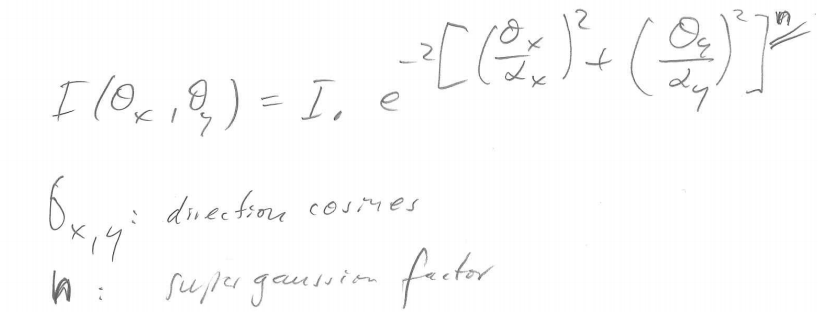
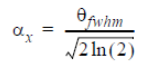
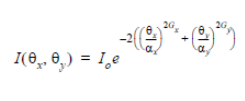
in the following equation from the manual:


are not the angles between the ray vector and the coordinate axis, but the direction cosines.


Can you please doublecheck the angle definition of so that we can clearify this?


Thanks a lot and best regards


Dirk


Userlevel 4
Badge +1

Hi Dirk,


I've inquired about the angle vs direction cosine question and I'll post more when I hear back.


For your earlier questions I think it's best to consider exactly what this source provides. If you give the angular distribution a strong supergaussian profile, you are going to find that it provides a square far-field intensity pattern. This is unphysical in many ways, but is consistent with the geometric ray trace you've set up. In sequential systems, you can use apodization in the System Explorer to create a Gaussian profile of the beam, but if you propagate those rays parallel to each other, you'll get an identical profile no matter how far out you go. It is similar here. Creating a profile, for example, does not recreate an actual Gaussian or supergaussian beam. I am not a light source expert and I can't say what kind of profiles a diode can provide. I suspect the inputs were intended to give maximum flexibility to the user.


To get a flat tophat intensity profile I would have a supergaussian intensity spatial profile with a beam width much larger than the diode itself. Remember, it's not going to place rays outside the physical diode dimensions regardless of what other parameters you set, so you won't be wasting that many rays. To get a circular profile, I think the annulus is the way to go. The supergaussian, by its definition, forces increasingly square shapes as it gets more and more super. The angular spread can be different than the spatial spread, so there you will want to use a Gaussian profile. I don't know if there is a way to duplicate different powers in the exponential term other than 2 to keep it circular. I do not see any here, and supergaussians are only used for this source in OpticStudio. If I come across one I will update this posting.

Userlevel 1

Hi Kevin,


I had an idea:

What I - and I think also others - need, would be the following:


If I am right, then this should provide a cirular / elliptical intensity profile in the farfield with the possibility to change the gaussian shape into a supergaussian shape. I will check this and keep you posted...


Again: Either way, the way like source diode is defined now does not make sense to me....


Best regards

Dirk

Userlevel 4
Badge +1

Hi Dirk,


I'm still waiting on an angle answer. You have an intriguing idea on modifying the supergaussian. It may be more consistent with the few examples of 2-d supergaussians I've seen which just use a circle of radius r rather than x and y.

Userlevel 1

Hi Kevin,


I have made a short sanity check yesterday and it looks like my definition does exactly what I was describing.

This would allow modelling not only LEDs but also Laserdiodes, which have elliptical 2d-intensity profile due to asymmetry.

I would be megahappy to have this implemented in Optic Studio;-)


Happy weekend

Dirk


Userlevel 1

Hello Kevin,


happy new year to you and your colleagues!


Is there any update regarding my questions above?

In particular I really would like to know if theta_x, theta_y are really the angles between the ray vector and the coordinate axis or the direction cosines.


Best regads


Dirk 

Userlevel 4
Badge +1

Hi Dirk,


I'm sorry, it looks like communications broke down. I thought this was posted. The developer group got back and confirmed that the angle measures are in degrees. Specifically, here was the reply:


Yes, the angular variables are in degrees. For example, here is a result with alpha_x = alpha_y = 10 and Gx = Gy = 1:


And here is one with alpha_x = alpha_y = 20 and Gx = Gy = 1:


Userlevel 1

Hi Kevin,


thanks for your reply, but this just says that the programming works well and provides plausible results for Gx=Gy=1.


Appart from the fact that the simulation results of Zemax Source Diode model do not make sense if Gx and Gy are unequal, 

this means that the documentation in the manual is misleading.


Again: You do not get a rotationally symmetric ray vector distribution, if for Gx=Gy=1 theta_x (theta_y) in the formula in the manual is interpreted as angle between ray vector and 

x-coordinate axis (y-coordinate axis). If this is something you doubt, what can I do to convince you? I have already posted my calculations as basis for discussion...


Best regards


Dirk

Userlevel 4
Badge +1

Hi Dirk,


Your point about the asymmetry for the supergaussians is quite clear and needs no further convincing. I'm going to put in a change to the documentation to make this clear to future readers. I don't know if we can make the definitions for supergaussian implementation into something different, as they are based in how that term is defined in existing literature.


Best,


Kevin

Userlevel 1

Hi Kevin,


there seems to be another hint, that there is something not consistent between documentation and programming.


Please find attached my zar-File. I chose alpa_x=alpha_y=60, Gx=Gy=1 and placed a rectangular detector 8 mm behind the diode.

Then I made FWHM measurement with the cross section intensity profile on the detector. Peak int. is 4.84 W/cm2. For the x coordinate ca. 3.8 mm you get half of the intensity. Then calculated the FWHM theta angle in the following way: tan(theta)=3.8/8 and got about 25.4 Deg for

the half cone angle and 50.8 Deg for the full angle. Then I took the following formula from the manual:


and calculated alpha: 50.8*0.849...=43. This does not fit to the model parameter alpa_x=alpha_y=60!!!


Best regards


Dirk


Userlevel 1

Hi Kevin,


I do not know if you have understood me 100%....


On the one side from my point of few the supergaussian definition zemax source diode model uses does not make sense if

G_x and G_y is not 1, because the intensity profile is in this case not rotationally symmetric or elliptical shaped in the far field.

But if Zemax wants to do it in this way...it's up to you!


But there is another point: 

For me everything looks like the Zemax programming is not consistent with this formula documented in the manual:


with theta_x and theta_y = angle between ray and x- / y- coordinate axis (..as you said). I showed that if you really interpret theta_x and theta_y as the angle between the ray vector and the x- / y- coordinate axis, you do not get a rotationally symmetric intensity profile for G_x=G_y=1 when you take the formula above. That means that this formula does not describe what Zemax is doing or my understanding is totally wrong. No one from Zemax seems to be able to clearify this. This is really unsatisfying... 


And it looks like there is another point:

The formula for alpha_FWHM calculation which is shown in the manual...(for details see my previous post). I also would like to clearify this...


Best regards

Dirk


Userlevel 6
Badge +2

Hi Dirk,


I hope you don't mind I reply your questions.


For your sample file, I think the problem is you put the detector too far and cannot well record for some large angle rays. If I set the detector to be very near to the the source. As below you can see the FWHM is roughly 72 degrees and thus we have 1/e^2 angle of 60 degrees.


For the parameter supergaussian, I think it's mainly for users to do a 'slight compensation' when the beam shape is not perfect ellipse.  I agree it may not make sense if you use a very large Gx and Gy.


I like your idea of using direction cosines L and M to replace the theta_x and theta_y. I think this is another choice, although I'm not sure if it's better than current one. At least with direction cosines, we have no way to chagne the beam profile when it's not perfect ellipse.


Just for another view point, I think you can say our current model can change the LD's beam profile using the super ellipse function as below.


https://en.wikipedia.org/wiki/Superellipse


If you don't mind, I'm planning to send your equation as a feature request to our product team. Unfortunately, I think this won't happen soon. The final decision is made by our product team. The fastest way to get a source with your equation is probably you customize your own source DLL. If you are interested in doing it in this way, I can support when you have questions.


I hope this clarifies it.


But please let me know if you have any more questions.


Thank you.


Best regards,


Michael

Userlevel 4
Badge +1

Hi Dirk,


You may be correct that I haven't followed all of your arguments correctly, so I've asked for assistance. Above you see Michael's reply, and here I'm going to quote verbatim from one of our developers. There is some overlap in what they are saying. Please feel free to reply to one or both of them as you see fit.


I saw that Dirk was using a value of alpha_x = 60 degrees and comparing that to the measured FWHM and finding a discrepancy. There are a couple reasons why there could be a discrepancy there. First, he is measuring FWHM using a rectangular detector. The intensity on the rectangular detector would include a cosine factor due to the angle of incidence rays are making when they are incident away from the center of the detector. Estimating the FWHM this way would tend to underestimate the width since the cosine factor is making the intensity fall off faster. The best way to get around this is to use a Detector Polar object.


Secondly, in the implementation of the sampling in OpticStudio, we resample from the distribution until the angles are physical. With alpha_x = 60 degrees, a certain amount of the mathematical distribution is falling outside of what are physical ranges for the angles and so resampling will cause a difference between the measured FWHM from the rays and the nominal FWHM calculated based on the functional form of the distribution. I don’t think there is an easy way to estimate what the effect will be, but with larger and larger values of alpha_x and alpha_y, I would expect the effect to become a noticeable shift away from the “ideal” relationship based on the functional form.


When I run his calculation with a Detector Polar object, I see the following results. The HWHM is about 35 degrees and thus the FWHM is about 70 degrees and the resulting alpha estimated from that is 70*0.849 = 59 degrees which is quite close to the 60 degree value set in the Source Diode parameters.


Userlevel 1

@Kevin


Hello Kevin.

Thanks a lot for clearification…

I was also thinking about the cosine projection which you get when you take a rectangular detector. For me it looks like Zemax Source Diode provides a true gaussian intensity distribution only on a polar detector.

But if this is right, this would mean, that the intensity distribution of this source cannot be true gaussian on a rectangular detector, because of this cosine projection effect, do you agree?

But this is not what (the slow axis of) a laser diode does. Just have a look on the formula:


en.wikipedia.org/wiki/Gaussian_beam


The irradiance dphi/dA in zylindrical coordinates is gaussian distributed. It is not the radiant intensity (W/sr) which is gaussian distributed.

For me this looks strange…


But let’s test it:

I will take intensity data from a rectangular detector and fit against a gaussian distribution...


Best regards

Dirk

Userlevel 1

Exactly what I expected....it does not show a gaussian distribution on a rectangular detector!

This is really not nice....


Settings: Gx=Gy=1, x-Divergence=y-Divergence=60

Rectangular detector 8 mm away from source diode

1E+09 Analysis rays

Detector rect.: 800 px * 800 px

No Data smoothing


Reply