Question

Smooth ray distribution from ray dataset - Non sequential


Hi there Zemax community,

In the past I have posted the following two questions related to what I want to do:


I am still trying to figure out how to properly import my rays into Zemax in the non-sequential mode.


What I ended up doing now, is that I sample N points from two separate uniform random distributions ( from 0 to 1) and then apply the following expressions:

phi = 2 * pi * u 

theta = arccos(2v - 1) 

with u and v being arrays of N random numbers from the uniform random distributions mentioned above. 

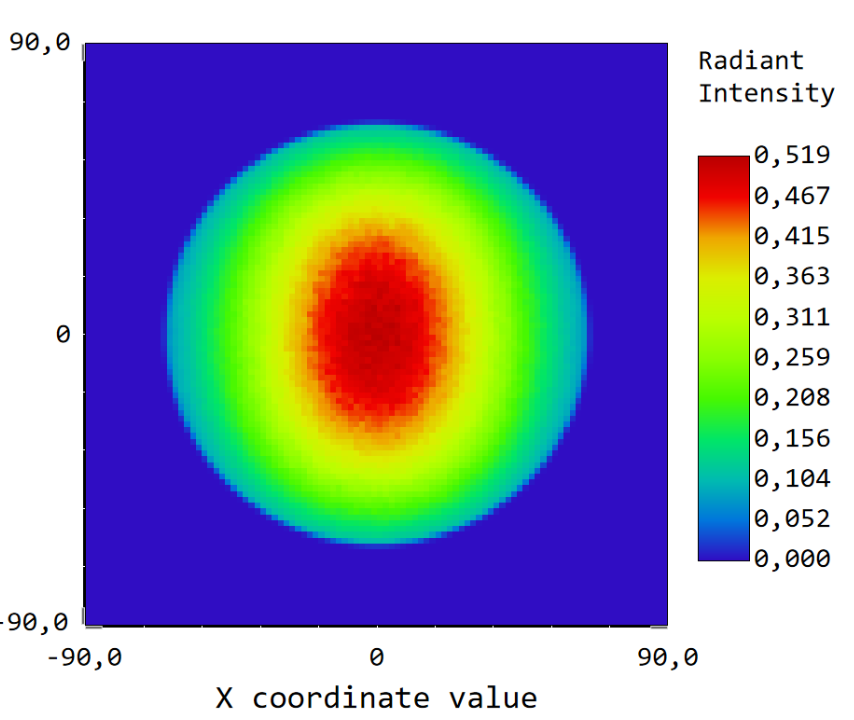
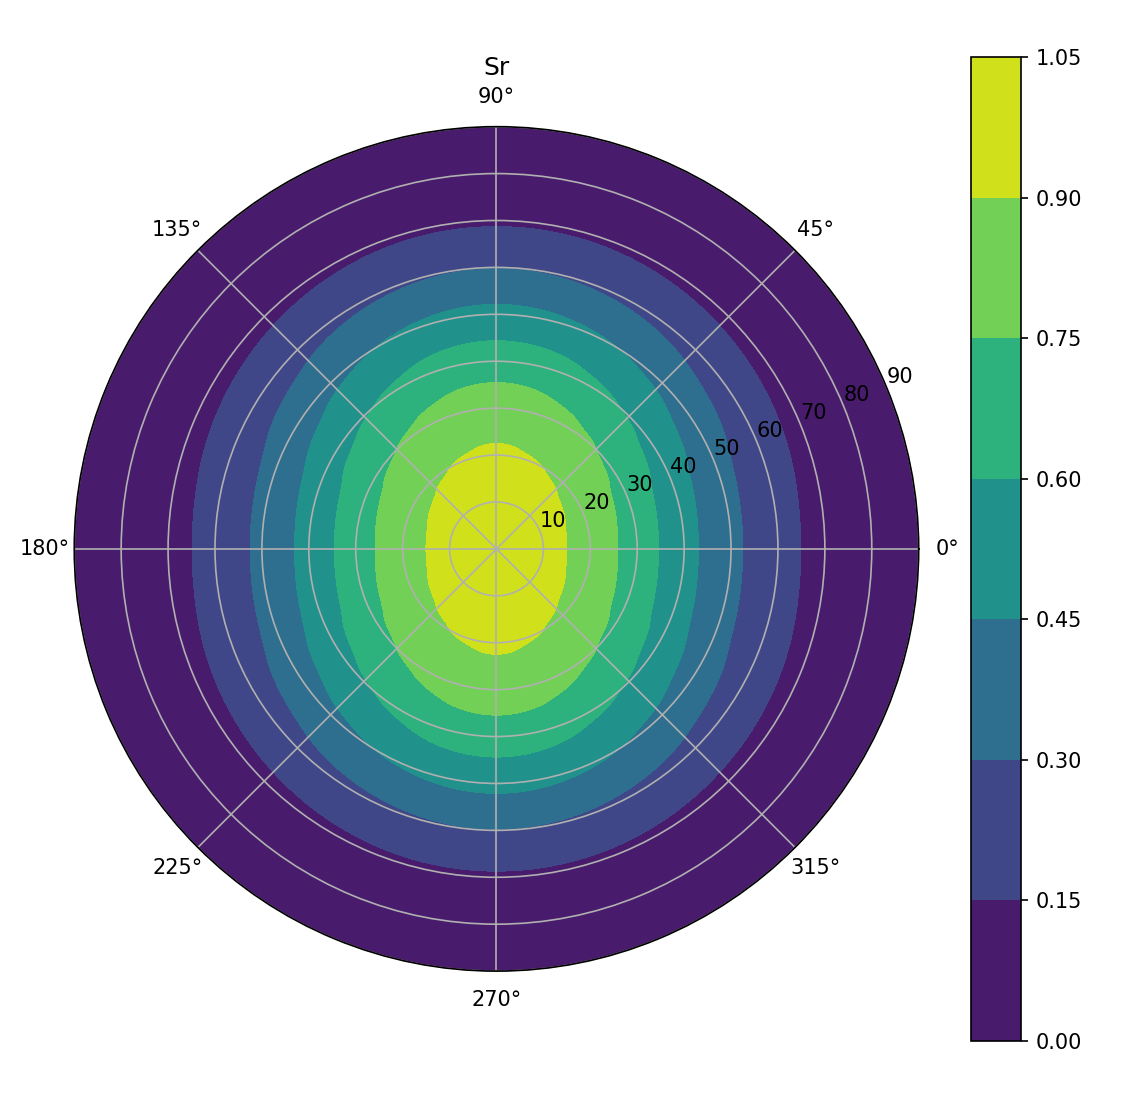
Then, using phi and theta, I sample my intensity function (which is expressed as a function of theta and phi) at the random coordinates phi and theta. 

Finally, using phi and theta I assemble the direction cosine components and export the associated ray data file as a .DAT file following the documentation from Zemax’s help file.

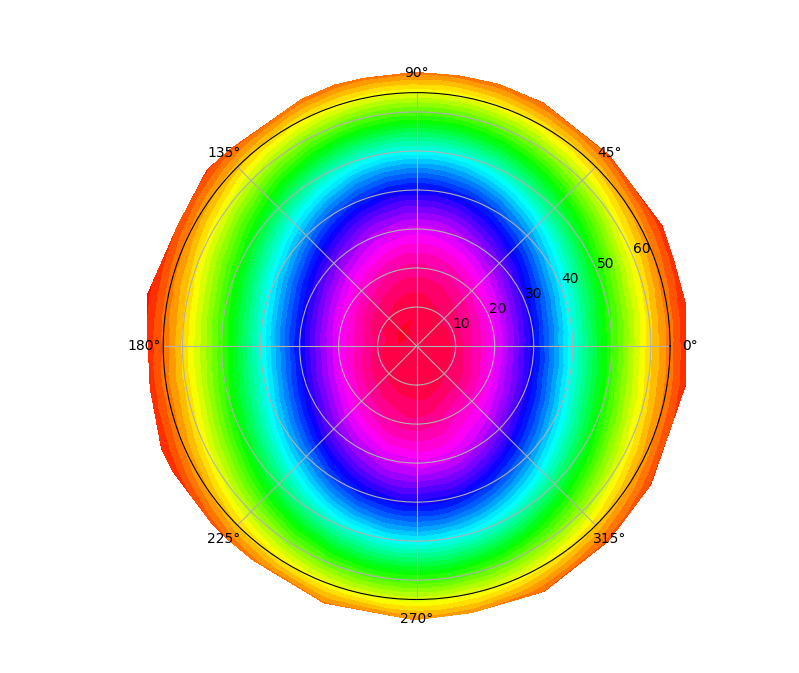
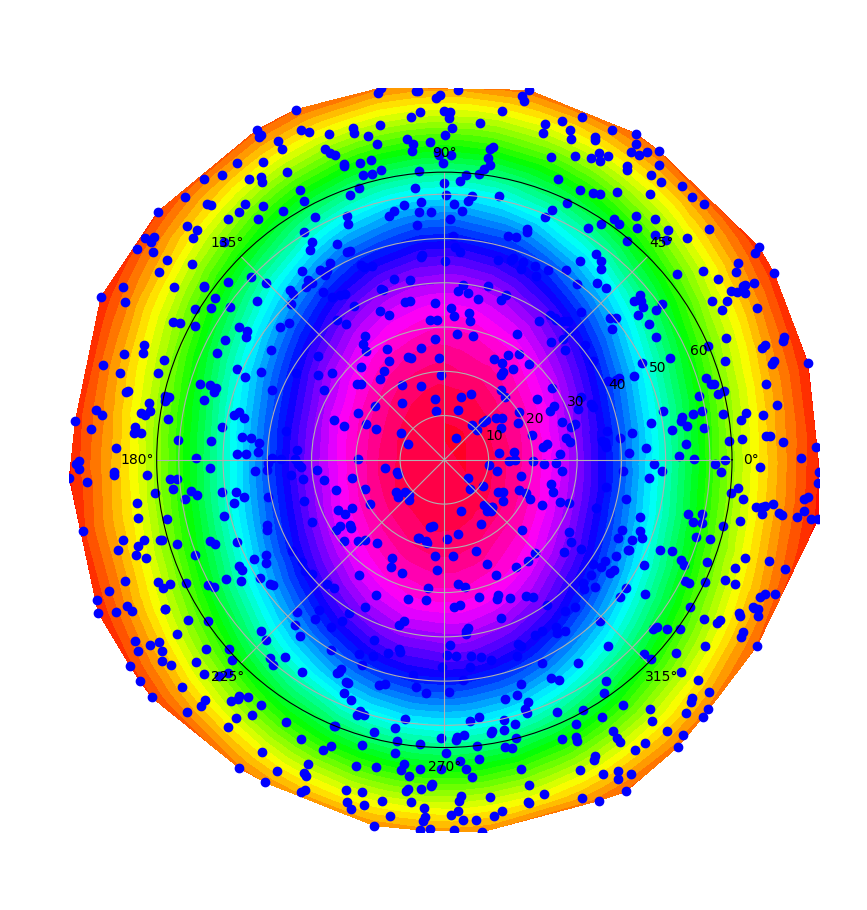
After importing the ray data set into Zemax, this is what I obtain:


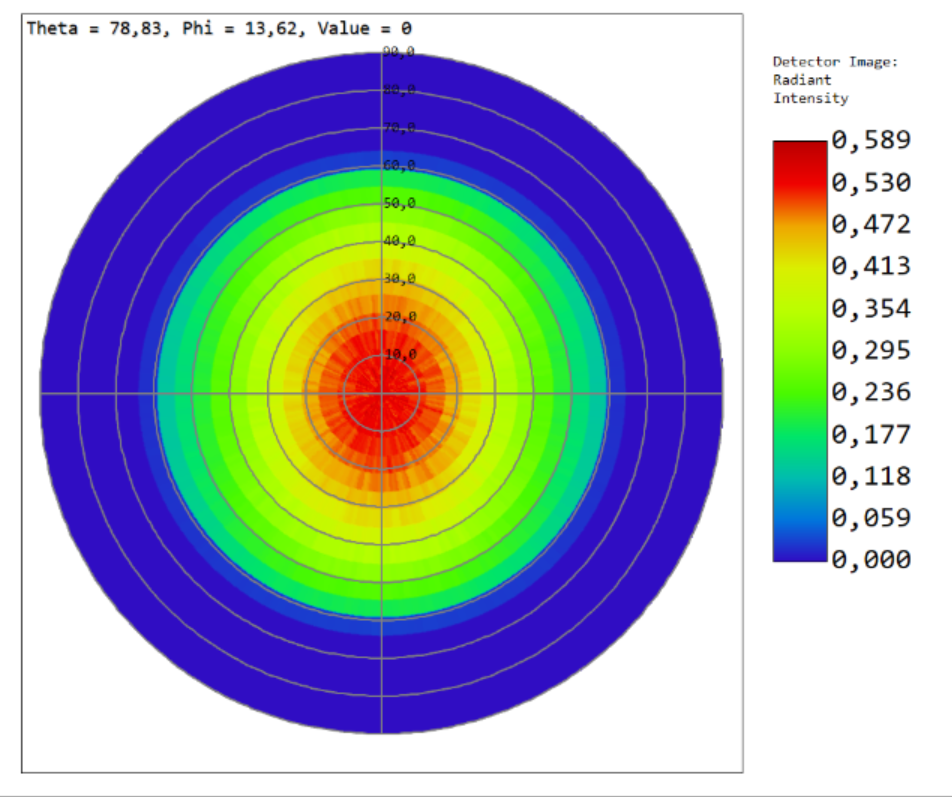
What I show above is the results from a polar detector. The pattern is somehow there but I can still see that the results are noisy and not smooth as I would expect from my original intensity profile:


What could be happening here? What could I do in order to obtain a smoother output on my detector? (My ray data set contains 3E7 rays) 


Thanks in advance 


4 replies

Userlevel 7
Badge +3

The first problem is that your original distribution is left-right symmetric but the ray-traced distribution looks like its rotationally symmetric, and that points to an error in how you are generating the ray sets.

My question is, given the simplicity of the original intensity profile, why are you not using either an IES file, a source two-angle or whatever. OS has many source models built in, I’m surprised you need to do to defining a ray set in order to model something as smooth as this.

  • Mark

Hi @Mark.Nicholson ,

Thanks for the feedback and reply.

Regarding your comments:

  1. As mentioned in my first entry, I use a random sampling scheme for my intensity profile. What I end up saving into the .DAT file is a list of entries with the form: 0 0 0 l m n relative_intensity in where l m and n are the direction cosines obtained from the random sampling of theta and phi.
  2. I have doubled checked that the intensity distribution obtained from the random sampling has in deed the desired shape:
  1. We can take a look as well to the distribution of sampling points. First, I can show you how are the points distributed if I just simply use a uniform sampling along theta and phi:


  1. As expected, for a uniform sampling along phi and theta, I have that the sampled intensity profile has a larger density of points for smaller theta angles in contrast to the outer part of the distribution. As far as I understand it, this is the reason why a random sampling scheme should be used instead. We can now take a look to what I get by using a random sampling scheme (using the expressions that I posted in my first entry)


  1. So in this case from what I understand, the sampling is more uniform in theta and phi space which should result in a better reconstruction of the original intensity profile. 
  2. It is then this random sampling scheme which I use for generating the .DAT file in where I use a large number of rays (1E6 or so). As I said, the .DAT file has the sampling points entries transformed into direction cosine values and the relative intensity values associated to each randon point.

From what I have mentioned and showed, do you observe any reason of why the intensity profile obtained from the polar plot would not replicate in a good manner the original intensity distribution? (As you said, it is not supposed to be circular symmetric and the resolution should be better as well right??) 

As for your second point, in general I would like to model my light sources externally either via a ray data set or via a DLL. What I do is that I have a set of FDTD simulations from where I extract some far-field information. I can transform this information into rays and in theory it should be possible to import these directly into Zemax right? (At least this is what I see is done between Lumerical and Zemax). The thing is that I do not use Lumerical for my FDTD simulations so I need to this conversion process “by hand” since I do not have access to the scripts used by Lumerical to generate the ray datasets. 

What do you think? Do you have any suggestion on how could I improve the fidelity of the reconstructed intensity patterns? Do you think using a ray data set with a .DAT file is not the way to go? Again, I would prefer to define my source characteristics directly from the FDTD data and not fitting them to some standard source models. 

Again, many thanks for the feedback and comments. 

Hi again @Mark.Nicholson,

I have taken another look to the results while using a rectangular detector from where I pull out the radiant intensity. You can see how in this case, the results have a better shape fidelity with respect to the original input intensity distribution:


However, the radiant intensity results from the polar detector are different:


My source is basically a point source for which, the intensity is not constant (the asymmetric intensity that we observe). For a polar detector, I should be able to reconstruct the original intensity from the rays that hit the detector surface perpendiculary to it right? (the origin of the rays is the same as the origin of the polar detector)

For the polar detector, I am using a resolution of around 2 degrees for theta and r. 

What do you think? What could be happening here? Why for the rectangular detector I get better results than for the polar detector? 


Userlevel 4
Badge

Hi,

It does not look like these are different, it’s likely just a sampling noise issue (which determines in turn the max in the color scale). Try plotting using cross section (and compare X and Y axes), or a “Directivity” plot.

The Polar detector’s sampling is not great when used  on wide angle distributions as yours. Around the center, the bins are very thin in azimuth and way too long radially. At high angles, the proportions reverse, the radial bin size is small and the azimuthal one becomes big. Overall, I would always advise the use of the rectangular detector, which also is quite faster.


Reply