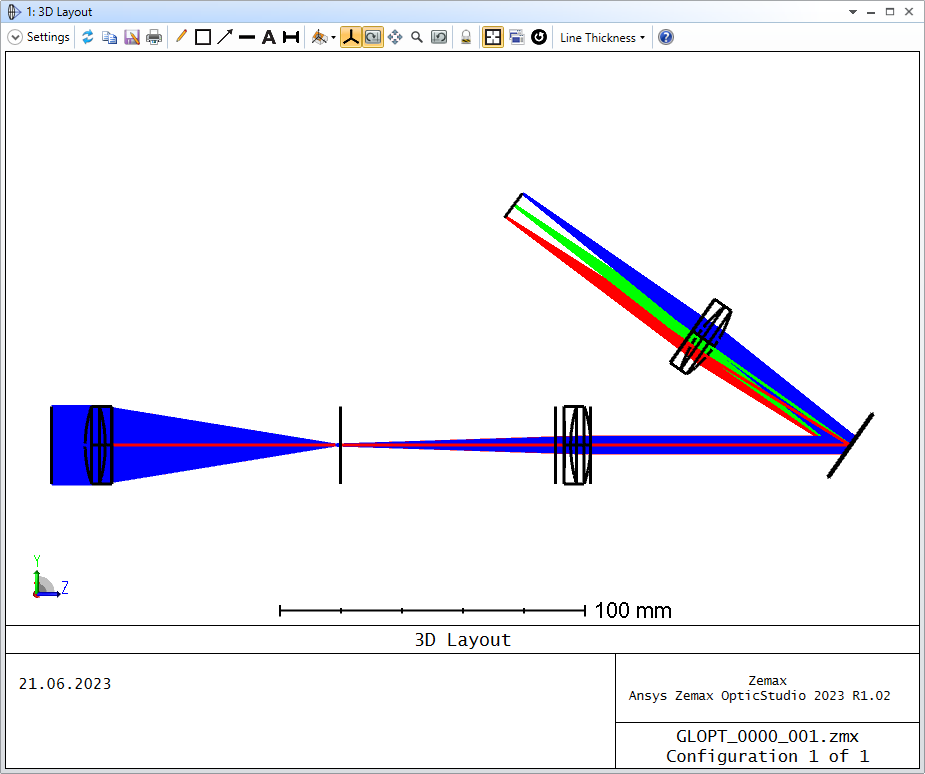
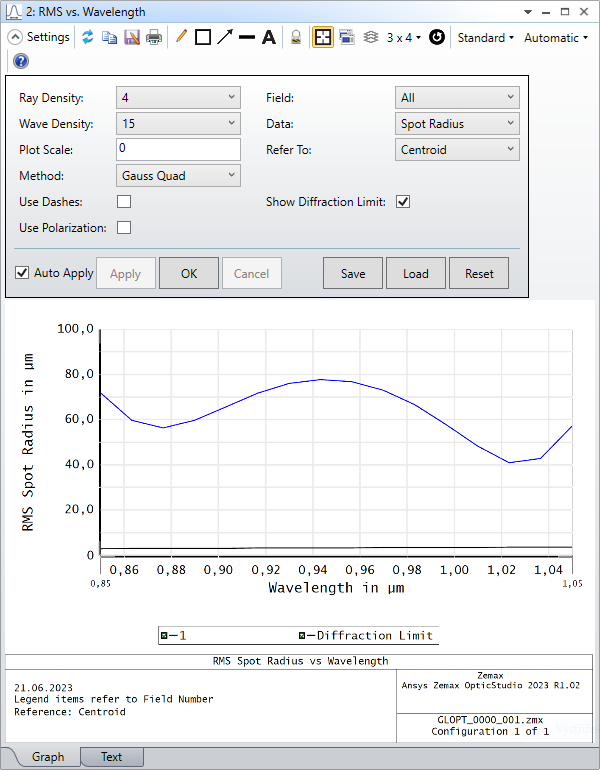
I am new in OpticsStudio and I am trying to design spectrometer for NIR range (850-1050nm). I would like to keep it simple and cheap. I started with input lens, which focuses the light into the slit (I started with circular slit aperture). Then a "standard" setup is used - achromatic collimator, gratings and focusing lens. I used achromates as a first try, but I would like to test cheaper planconvex lenses. I also use aperture in a front of achromatic collimator to decrease stray light and increase spatial resolution (but I am not sure if this helps). I estimated based on some theory, that slit width can be around 100 microns (I need resolution only around 2 nm). It looks OK, but when I change the slit diameter and plot RMS (spot radius) vs. wavelength is rather high. I would also expect that it will change with the change of slit diameter, but it doesn't.
3. Why the RMS spot radius is not changing with the slit diameter?
4. Does replacement of last focusing achromates with planconvex lens make sense?
Could you please help me.
Ragards,
Radim
DesignRMS spot for 0,05 diameter
Best answer by Benjamin.N
Hello Radim,
the setup looks fine so far. Concerning your questions:
2. Typically, the slit of a grating spectrometer is rectangular instead of round. This is because the spectral resolution (= spot size along the wavelength axis of the IMAGE surface) is almost exclusively affected by the slit width, and the slit height can be controlled independently. The slit height can, for example, be matched to the height of the sensor pixels divided by the magnification of the spectrometer. The slit height is often chosen as large as possible to maximize the light throughput and therefore the signal-to-noise ratio.
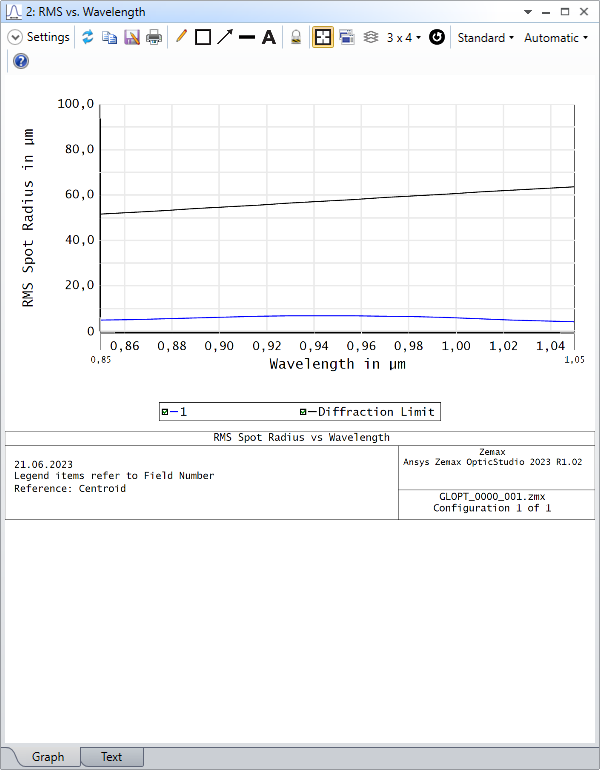
3. The issue here is that the system aperture type is set to “Entrance Pupil Diameter”. I suspect this makes Zemax ignore the surface aperture (the one that models the slit) when the RMS spot size is calculated. I suggest to change the aperture type to “Float By Stop Size”. Now you can control the slit diameter with the semi-diameter of the STOP surface and the RMS vs. wavelength plot behaves as expected.
4. This depends on your performance specifications and system parameters (spectral resolution, sensor size, system size, grating, SNR, ...). If you achieve the desired performance with a cheaper lens, go for it. Keep in mind that component and construction tolerances must also be considered when you set up the spectrometer in the lab. It makes sense to include a tolerance analysis when you assess the performance of different lenses.
A more extensive and detailed analysis of the spectrometer performance would probably have to make use of the non-sequential mode, where the actual intensity distribution on the sensor and stray light can be examined.
the setup looks fine so far. Concerning your questions:
2. Typically, the slit of a grating spectrometer is rectangular instead of round. This is because the spectral resolution (= spot size along the wavelength axis of the IMAGE surface) is almost exclusively affected by the slit width, and the slit height can be controlled independently. The slit height can, for example, be matched to the height of the sensor pixels divided by the magnification of the spectrometer. The slit height is often chosen as large as possible to maximize the light throughput and therefore the signal-to-noise ratio.
3. The issue here is that the system aperture type is set to “Entrance Pupil Diameter”. I suspect this makes Zemax ignore the surface aperture (the one that models the slit) when the RMS spot size is calculated. I suggest to change the aperture type to “Float By Stop Size”. Now you can control the slit diameter with the semi-diameter of the STOP surface and the RMS vs. wavelength plot behaves as expected.
4. This depends on your performance specifications and system parameters (spectral resolution, sensor size, system size, grating, SNR, ...). If you achieve the desired performance with a cheaper lens, go for it. Keep in mind that component and construction tolerances must also be considered when you set up the spectrometer in the lab. It makes sense to include a tolerance analysis when you assess the performance of different lenses.
A more extensive and detailed analysis of the spectrometer performance would probably have to make use of the non-sequential mode, where the actual intensity distribution on the sensor and stray light can be examined.
thank you! I changed the system aperture as you suggested and it seems to work as expected (however it is slightly confusing to me that 'Zemax ignore the surface aperture' when I set “Entrance Pupil Diameter” option).
Yes, I am goint study tolerance analysis and continue with this step.
One more question - when I run the optimization and plot the RMS Spot Radius v. wavelength then I've got values under Diffraction limit. How to interpret this?
The RMS spot radius is calculated from ray tracing data. Ray tracing only considers geometrical optics and no wave optics (hence diffraction), it is therefore possible to achieve spot sizes below the diffraction limit in a ray tracing simulation.
If the geometrical spot radius falls below the diffraction limit, the actual spot size in your optical system is limited by diffraction and not by optical aberrations.
I wouldn’t use spot radius...spot in x or y will make more sense as the image is an image of the slit. Assuming the slit is along the y-axis, the spot size in x will give you the spectral width of the spectrometer, for example
Thank you Mark for your comment. I tested the simulation with rectangular slit and it seems to be ok (I used only one direction as you sugessted). However, I found also slightly different setup of the spectrometer - in my current setup the slit is placed between the first and second lens (app. in the focal plane of the collimating lens). I also found a setup, where the slit is located before the very first lens, which is also probably ok. Can you please give me some pros/cons of these two setups? Thanks!
Usually in a spectrometer we image the input slit onto the output sensor and have a grating or prism in the chain so that the image is split up spectrally. Something like slit - collimator - dispersion - focusing - sensor. That sounds like your second implementation.