Solved

Problem with grid phase

  • 23 March 2022
  • 3 replies
  • 522 views

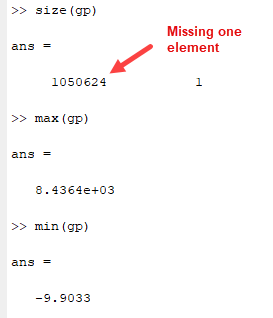
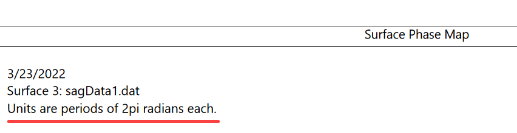
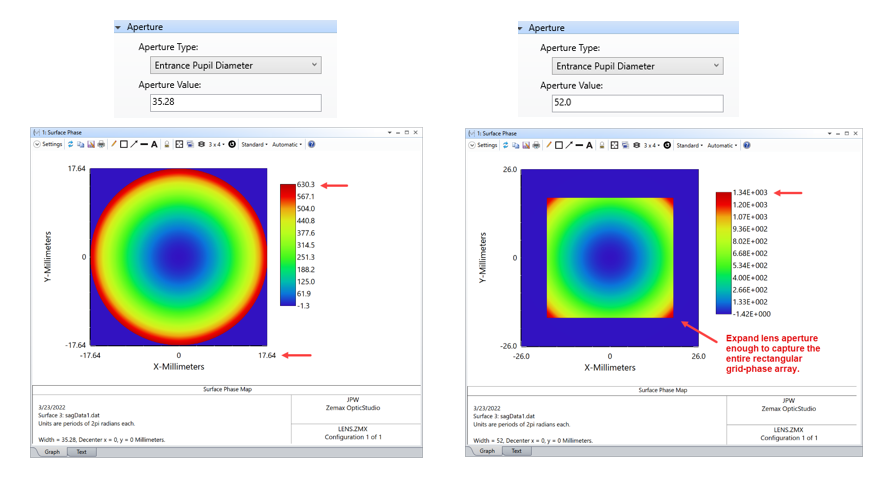
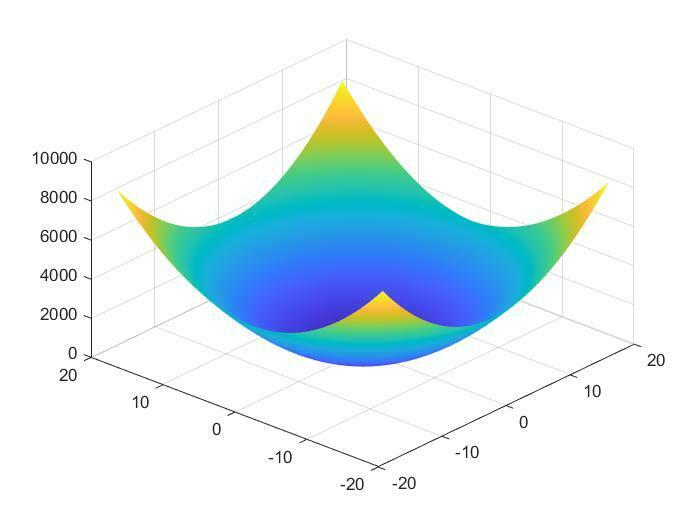
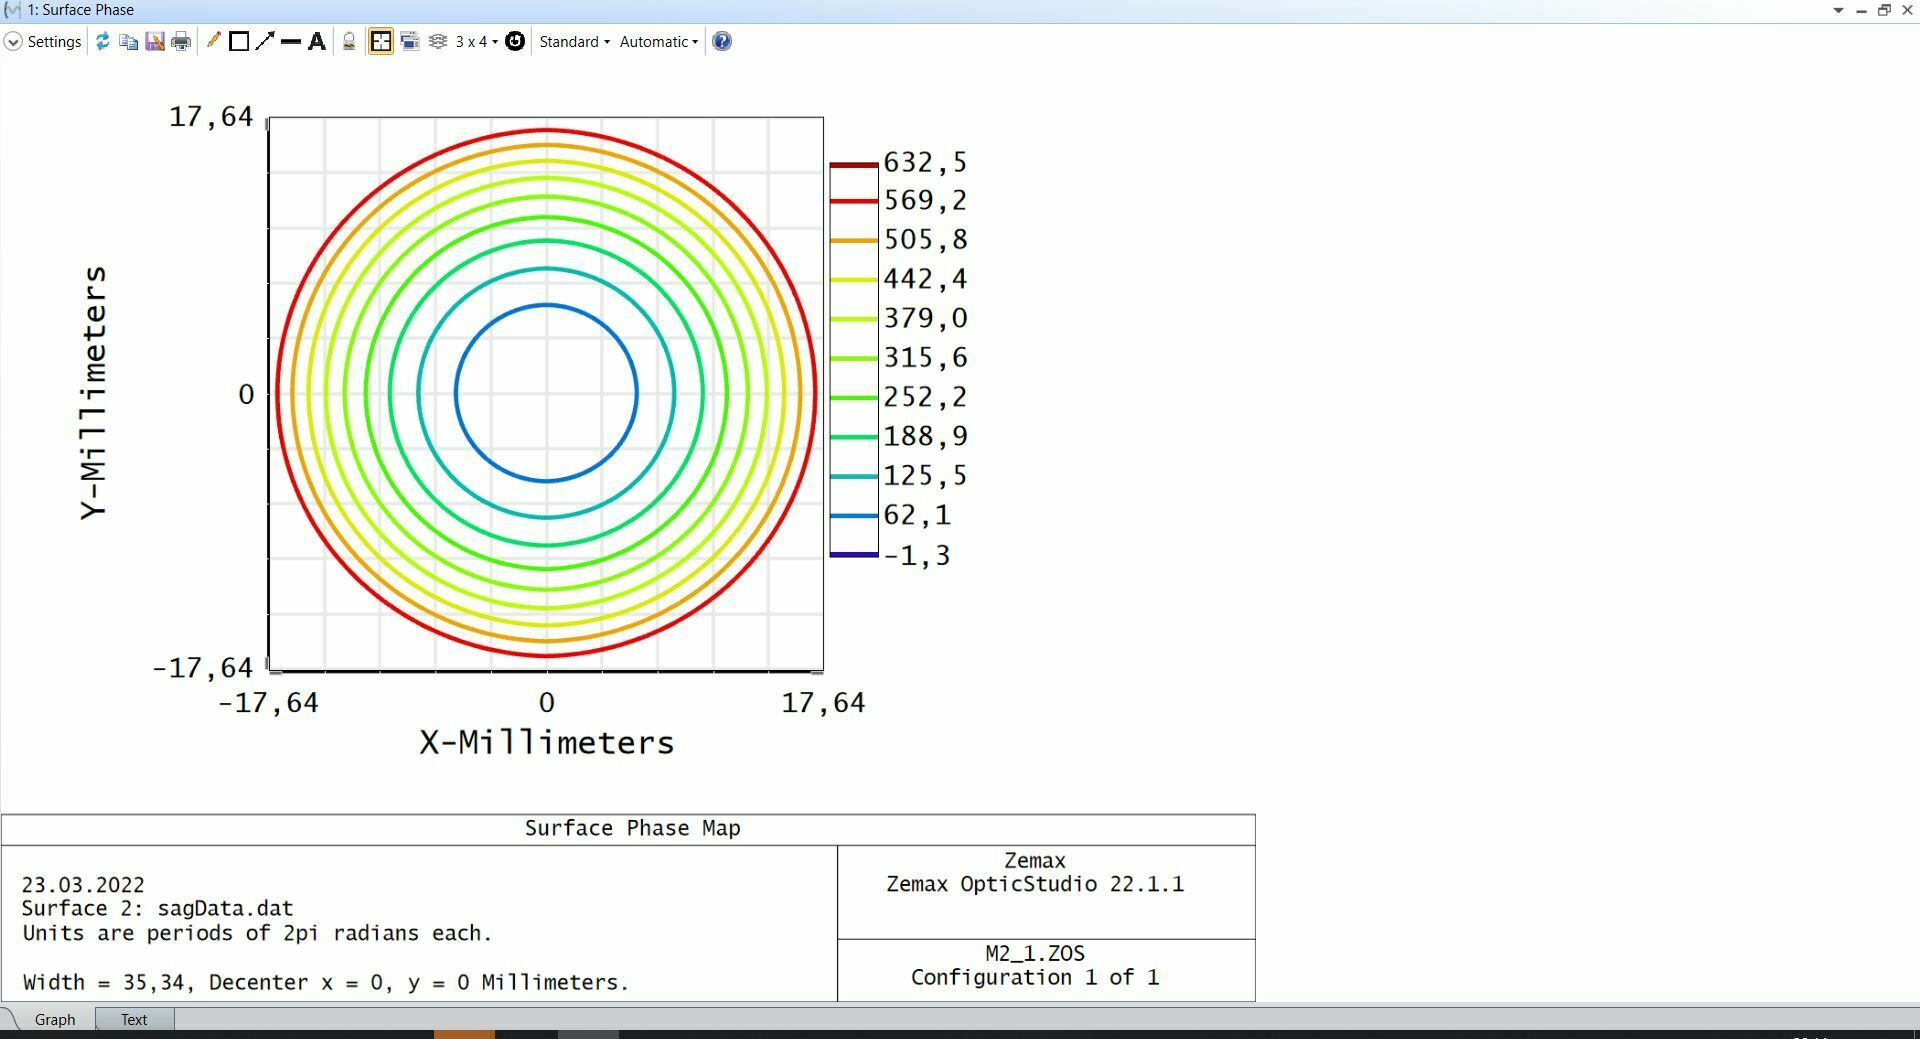
Hello! I’m trying to import a phase profile of DOE from matlab with DAT file and Grid Phase surface. You can see in this file and in matlab screenshot that max value of phase profile is near 4000 for circular aperture. But at the surface phase figure in optic studio max value is about 670.  And min value is -1,3 instead of 0. For writing this file I used code discribed in Knowledgebase articles about Grid Sag because this surface are very similar. Why OpticStudio doesn’t import this file correctly?

So is that something wrong with DAT file or this code doesn’t match with Grid Phase? Could you please discribe suitable code for matlab?


Thank you for the future answers!!

icon

Best answer by Jeff.Wilde 23 March 2022, 21:02

View original

3 replies

Userlevel 7
Badge +3

I see a few issues, nothing major. 

First, your data set is missing one element.  If I strip the first-line header and then load it into Matlab, I should see a vector with 1025*1025 elements, but you are not saving the last value.  Also, the min value is negative.  So your raw data set has negative values (as well as some NaN values), which is why you are getting a negative min value in OpticStudio.  You might want to carefully check your data set to make sure it contains what you expect.


Secondly, the raw grid-phase data set has units of radians.  In OpticStudio the phase is divided by 2pi, so it is displayed in “waves.”  This explains the scaling discrepancy you observe.


Lastly, you are not displaying the full data set in OpticStudio, but instead it is being clipped by the circular system aperture.  If you open up the aperture, you will see the whole profile with the correct max value.


Hello, Jeff! Thank you very much for you answer. I will try solutions that you described.

Userlevel 7
Badge +3

You’re very welcome Dmitriy. Let us know if you have any problems.

Reply