Question

Power Pupil Map question


Jeff.Wilde
Luminary
Forum|alt.badge.img+3

I don’t understand some results generated by the Power Pupil Map analysis feature.  Perhaps someone here in the forum can provide insight.

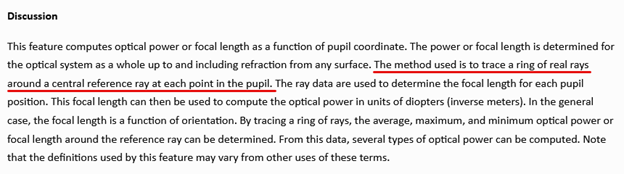
For a general lens system, consider the wavefront leaving the exit pupil.  This wavefront is typically not spherical because of aberrations, or perhaps because the lens is a freeform optic.  In either event, the min and max values of the local curvature at any point on the wavefront in the pupil determine the min and max focusing power associated with that pupil location.  Equivalently, we can look at the max and min local focal lengths, which are just the reciprocals of the powers.  The Power Pupil Map is a nice tool to help the user visual this effect.  Several options are available for the form of the data.  Also, a surface must be selected.


Consider a simple test case using a plano-convex lens that focuses an on-axis collimated beam.  Spherical aberration causes the exit pupil wavefront to have local curvature that varies over the pupil. 


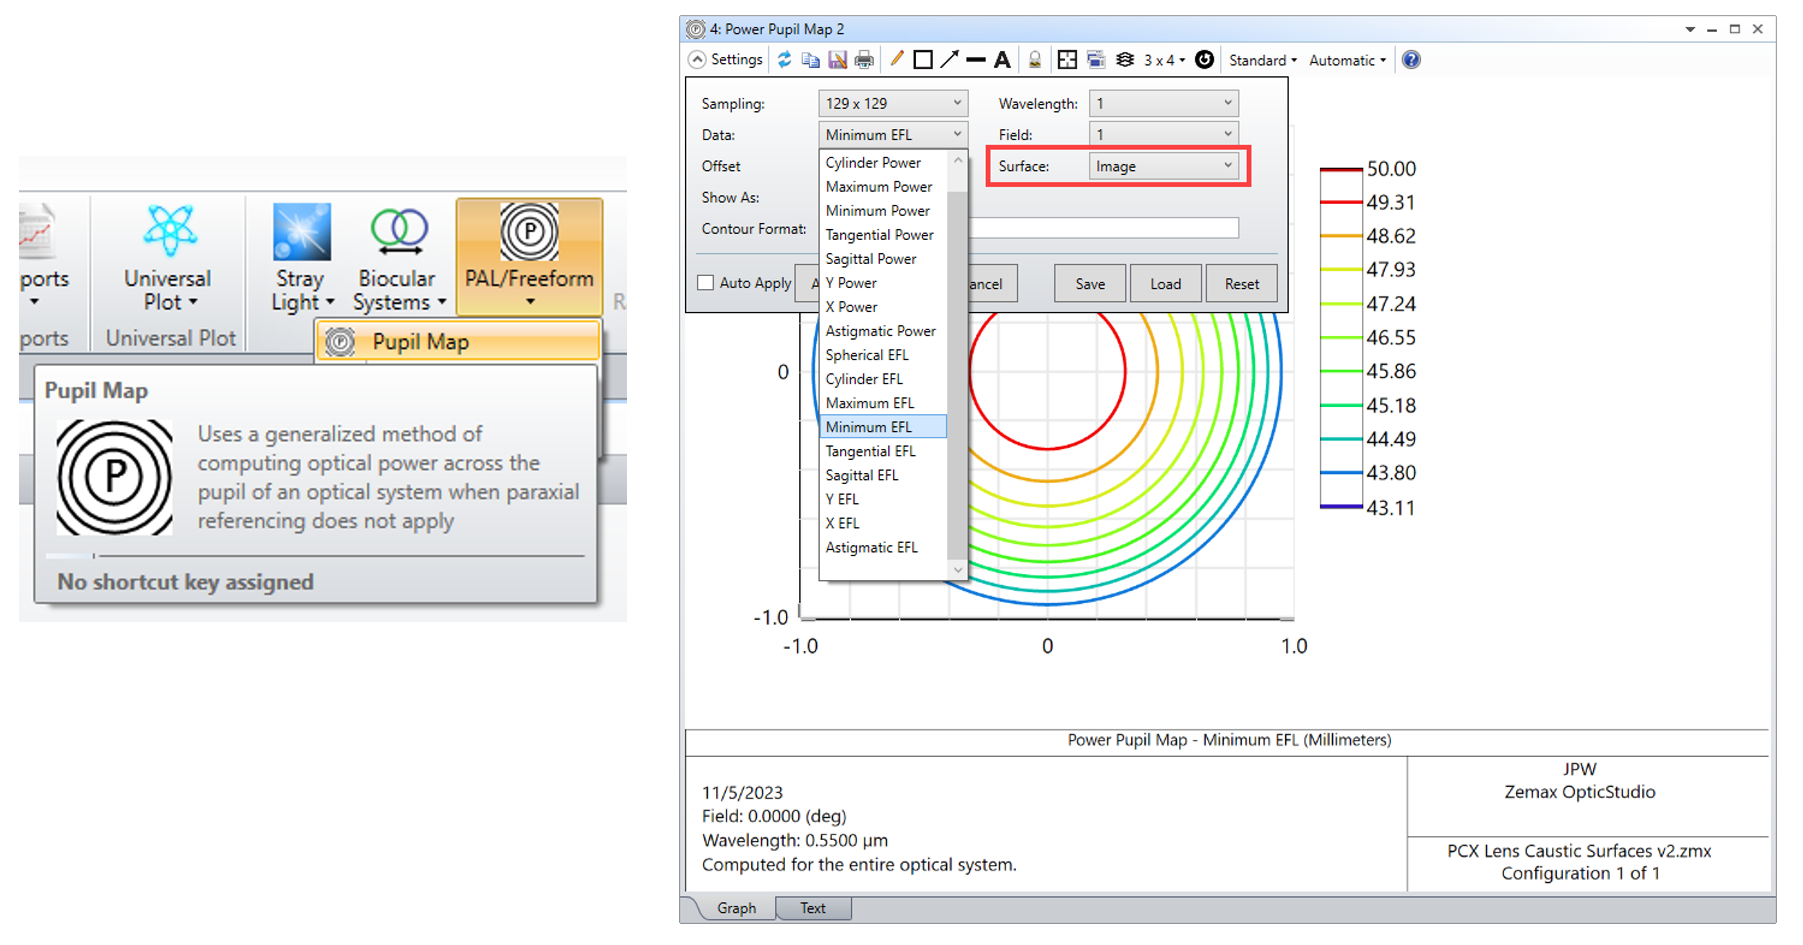
Presumably the effective focal length is found by looking for the z-location in image space at which two neighboring rays cross one another (or, if they don’t actually cross, where they reach minimum separation).  Two neighboring rays in the center of the pupil will cross at the paraxial focal plane, whereas two neighboring rays at the edge of the pupil will cross closer to the lens.  In general, for any point in the pupil there are two crossing locations that lead to max and min focal planes because the “neighboring ray” associated with any reference ray can be selected from a ring of rays in the pupil surrounding the reference  ray.  Let’s refer to the reference ray plus some neighboring ray as a differential ray pair.   

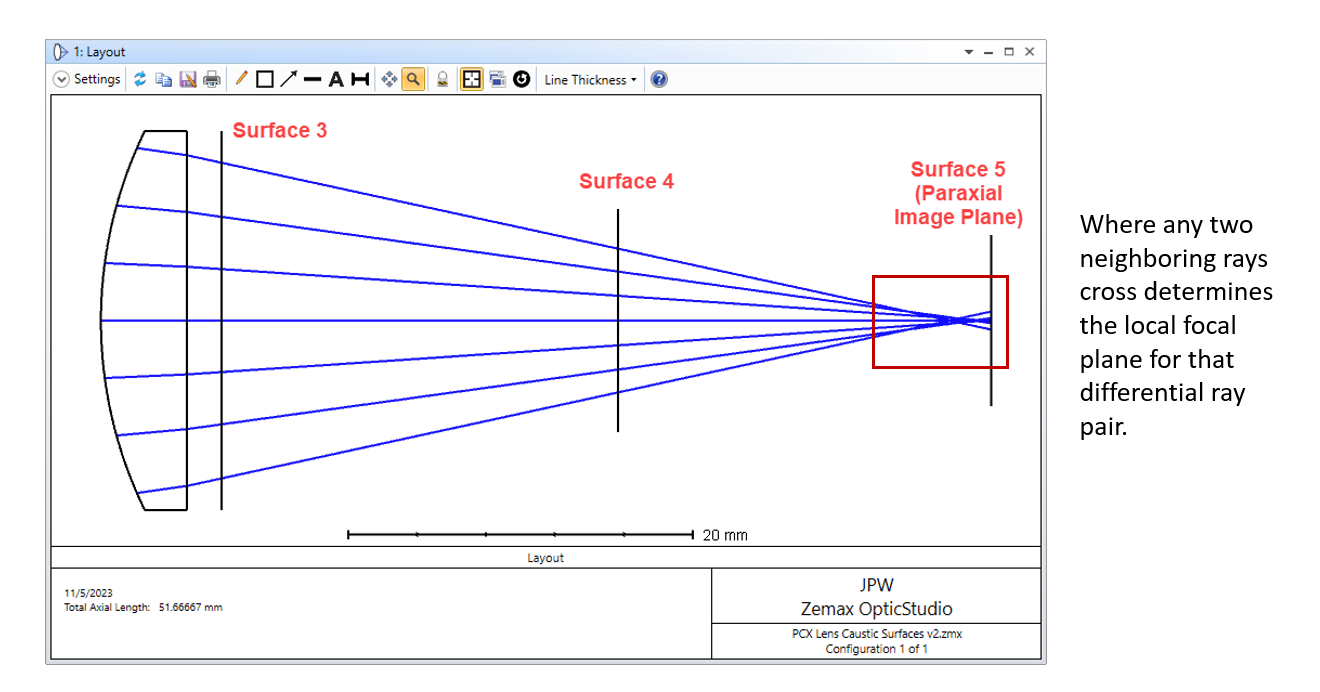
For any differential ray pair, the corresponding local focusing power or local focal length can be found from the ray data at any location in image space.  Presumably the “local effective focal length” is simply the z-distance between the local focal plane (i.e., the xy-plane where the rays cross, or come closest to crossing) and the image-space principal plane of the lens.  However, when I look at the results for this test case, I find the effective focal length changes depending on which surface is selected (three options are shown above, all three are just planes in image space).  Here are plots of the Max and Min effective focal length vs Py for the three surfaces: 


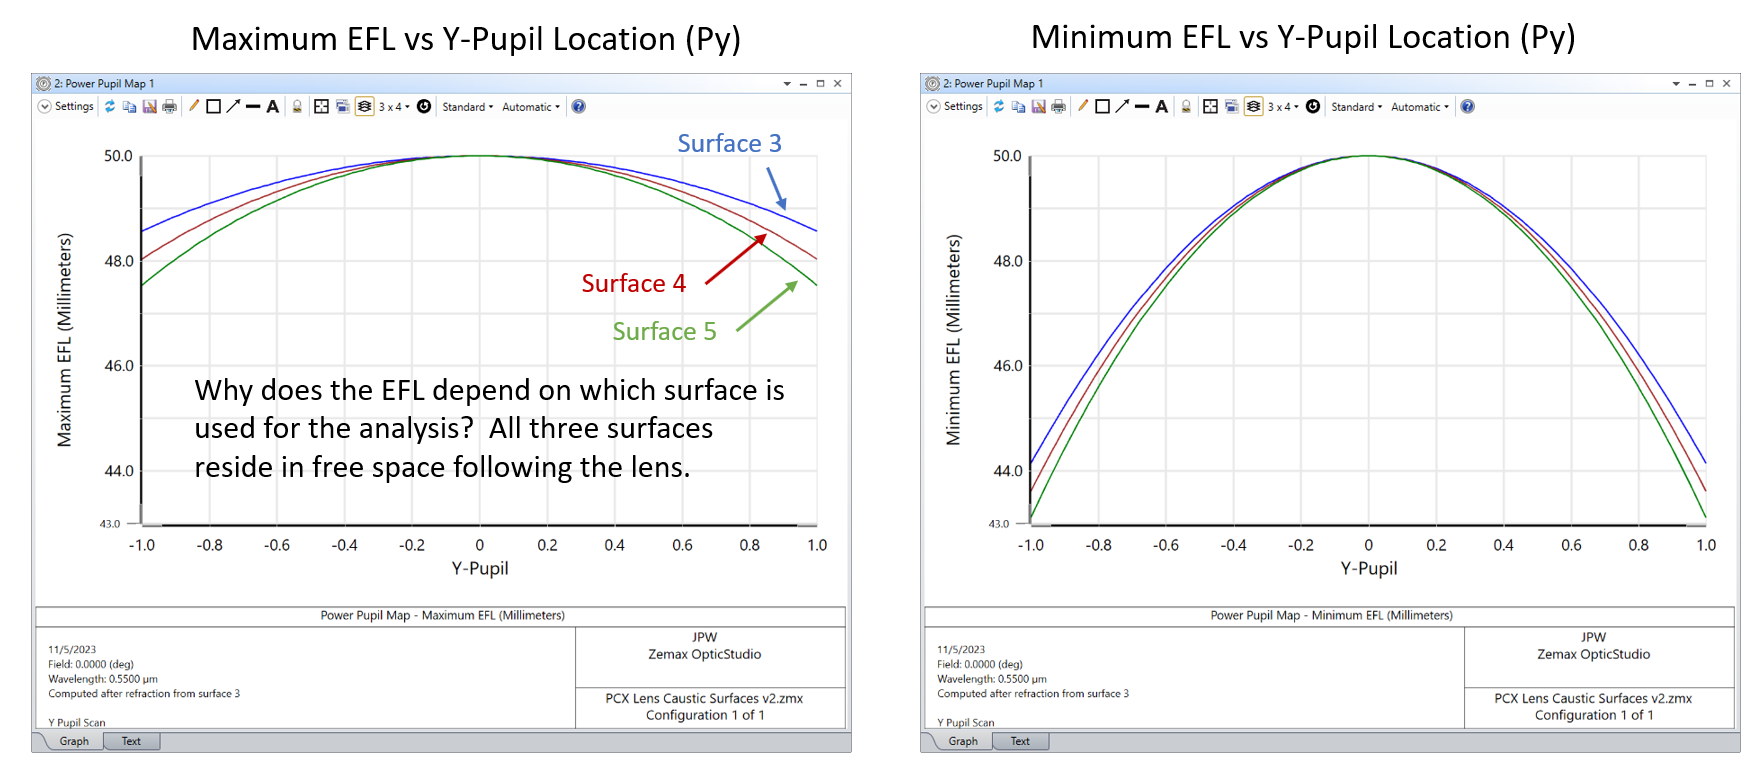
My question is: why are the results surface-dependent?  Once the rays leave the lens, they are propagating in free space, and the location at which any differential ray pair crosses in image space should not depend on which surface is used to extract ray data for performing the calculation. 

Upon digging a little deeper, it looks like selecting Surface 5 (which is the paraxial image plane) produces the correct results.  I say this for two reasons.  First, I’ve done my own numerical analysis of this test case and find results that agree with the Surface 5 selection.  And second, only the min and max curves for Surface 5 lead to corresponding changes in focal distance that are related by a factor of three (which is known to be the case for spherical aberration -- see J. Sasian’s book, “Introduction to Aberrations in Optical Imaging Systems,” Eq. 9.5).  If Surface 3 is selected, the max/min ratio of focal change is closer to 4.1, which seems incorrect. 

So in this case it appears that picking the paraxial image surface is the way to go.  However, the help documentation is at odds with this choice.  It states:

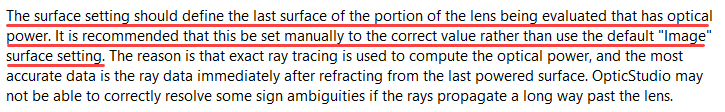
In my test model, Surface 1 is actually the last surface that has power, but let’s assume the help documentation is referring to the last physical surface of the lens, which is Surface 2.  This choice yields results that are close to those obtained when using Surface 3, but that’s to be expected since Surface 3 is only a few millimeters away from Surface 2.  In any event, my main point here is that the help documentation would seemingly lead the user to select a surface that produces incorrect results.

Just curious if anybody has some thoughts on what is going on here?  Maybe I’m missing something…

Thanks,

Jeff

Forum|alt.badge.img+1

Hi, Jeff.  I would need to ask a developer to dig into the core code for me to confirm this 100%, but I believe that the power pupil map considers the real object and image positions and shapes.  So the calculation is like this: Launch a ray from a selected field point that passes through the requested stop location (Px, Py), Launch a ray to the same pupil point with a small change in field angle, Measure the shift on the image plane between the two rays, Solve for real focal length or power using: tan(delta theta) ~ (shift in the image) / (real focal length). 

(Note that ray aiming should always be in for this analysis, because it will change the results if a ray doesn’t hit the stop in the exact location requested.)

So the calculation doesn’t consider whether the rays actually reach focus at the surface; any problem where the rays don’t cross on the detector becomes an aberration and would presumably be designed out, if possible.  This calculation method corresponds better to things that you can actually measure in the hardware world, IMO.

The Help file statement does seem to be incorrect.  One wouldn’t need to raytrace all the way to the image surface to get the value of (shift in the image), of course; one could use the exit angle of the two rays after the last surface and use the distance to the image plane to calculate the shift. But I suspect this is *not* what the algorithm is doing, in this case. 

This whole calculation is quite different than the paraxial case, of course, where all rays in the pupil cross at the same point, and that point defines the location of the (flat) paraxial image plane.  And rays at any field angle will shift by the same amount on that focal plane, for a constant focal length across the pupil.  The paraxial focal length also assumes an object at infinity.


Jeff.Wilde
Luminary
Forum|alt.badge.img+3

Hi Erin,

Thanks for your feedback.  Yes, I assume the calculation is based on real rays.  In my example I was examining spherical aberration in the pupil.

I still don’t understand why the power pupil map would change upon selecting a different surface following the lens.  In my case I had three different planes (all in air) in image space.  The power map changes based on which plane is selected.  Why??

Thanks,

Jeff


Forum|alt.badge.img+1

Hi Jeff.  I’m still checking into the details to confirm, but it’s because the surface selected is where the “real” power or focal length is measured.  The method I’ve outlined above only measures shift of the chief ray, at the selected surface.   That’s consistent with your observation that the results are what you expect if you choose a surface at the paraxial focal plane.

Why do we do it this way?  Because centroid location at a known surface is the only thing one can really measure in the lab.  Assuming that one also knows the input field angle, and the detector location, to some reasonable level of accuracy.

As you’ve seen, if you try to define this by where rays cross, and where one begins the focal length measurement, everything gets undefined relatively quickly.  Suppose you measure from the principal plane to the focal plane.  Does one use paraxial or real rays to find the principal plane?  Does the principal plane have a curvature, and I need to find it separately for every pupil point?  Does one only use rays near the axis, for pseudo-paraxial rays?  Does one use a grid of rays and find the minimum spot size, and that’s where the principal plane is, or two rays?  Same questions arise immediately for the “focal plane.”  How do we locate it?  Do we let it have a curvature?  Paraxial, pseudo-paraxial, or real rays? Etc. 

It’s cleaner to let the user tell us at which surface they want to see a variation in focal length, assuming that’s where they’ve placed the detector in the lab.
 

In the hardware builds that I’ve worked on, if we are choosing some definition from the mess of options above, it must be clearly defined and shared with the entire team; and then all analyses checked to ensure that we are all using the same definition.


Jeff.Wilde
Luminary
Forum|alt.badge.img+3

Hi Erin,

I went back and checked the help documentation for the Power Pupil Map, and it indicates that a ring of real rays around any given point in the pupil is used, and the resulting ray data can provide the EFL for that pupil location:


This is different than what you describe.  So, I’m even more confused now.  

You raise a number of good points, but I’m just curious to better understand how the ray data are currently being utilized to calculate EFL as a function of pupil position (which would then probably shed insight on why the results vary somewhat with surface selection).  Hopefully someone on the development team can help provide the details...

Thanks,
Jeff


Reply


Cookie policy

We use cookies to enhance and personalize your experience. If you accept you agree to our full cookie policy. Learn more about our cookies.

 
Cookie settings