Hello there friends from the Zemax community,

Once again, I would like to ask for your guidance/help with something that I need to implement.

I am interested in performing a polarization ray-tracing analysis in non-sequential mode. Let me explain a bit more about what my situation and setup is.

I start from some FDTD simulations from where I extract far-field information (Here I model a single point emitter).

Since I am assuming that there is no source of decoherence, from my FDTD simulation I am able to extract values of field components (Ex, Ey, etc) that match to a single wavefront surface. In summary, I have a point source for which I can extract the far-field information.

Using these field components, I have managed to generate the Poynting vector and consequently used this information to set up a sequence of rays which I import into Zemax. In this case, for each ray I have the direction cosines and the relative intensity which corresponds to my previously calculated Poynting vector.

In general this works nicely and I was able to run my initial ray tracing analysis.

Now, I would like to trace not only the “field intensity” but the field components (i.e Ex and Ey) and obviously obtain information on how these change as they propagate through my optical system. 

At the end, I want to apply some diffraction integral expression which requires the knowledge of field components and not just the intensity associated to the rays. This is the main reason behind my interest in doing these polarization ray-tracing analysis.

Any comments on how to do this? I am not sure if this is something that could be supported in the non-sequential mode?

Any comments and feedback will be appreciated!


@CJ27:

Off hand, I’m not sure if it’s possible to do what you want in non-sequential mode.

Instead, I would suggest you consider a sequential model, if possible, and then utilize polarized POP beam propagation.  You can import FDTD data (e.g., near-field data from a fiber or waveguide source) as a ZBF file with polarization included to represent the starting beam field.

Regards,

Jeff


Hi ​@Jeff.Wilde,

Thanks for the feedback.

Well, actually I would just like to do the geometrical ray tracing through the optical system in this case. Let me explain a bit more about my system configuration and why I just want to do the geometrical ray-tracing:

I have a freeform surface optical system that I externally designed. This I already import into Zemax using STEP files (non sequential mode). 

My source is actually a point emitter with a really large NA value, therefore I would prefer not to use the POP module in this case. The only thing that I am interested in, is propagating the field components (geometrically) through the optical system up to a given plane and then from there, apply a diffraction integral to calculate the PSF. 

This means, I am not interested in evaluating the diffraction within the system. I just need to compute the field components from the polarization ray-tracing.

Since you suggested considering a sequential model, do you think that my system and my main objective would be compatible with the sequential mode? :

-Is it possible to define a custom source with field amplitude information (polarisation) in sequential mode? Is there maybe any reference to this?

-Can I also import step files into sequential mode? 


Thanks again for the feedback and help!


Hi ​@CJ27 :

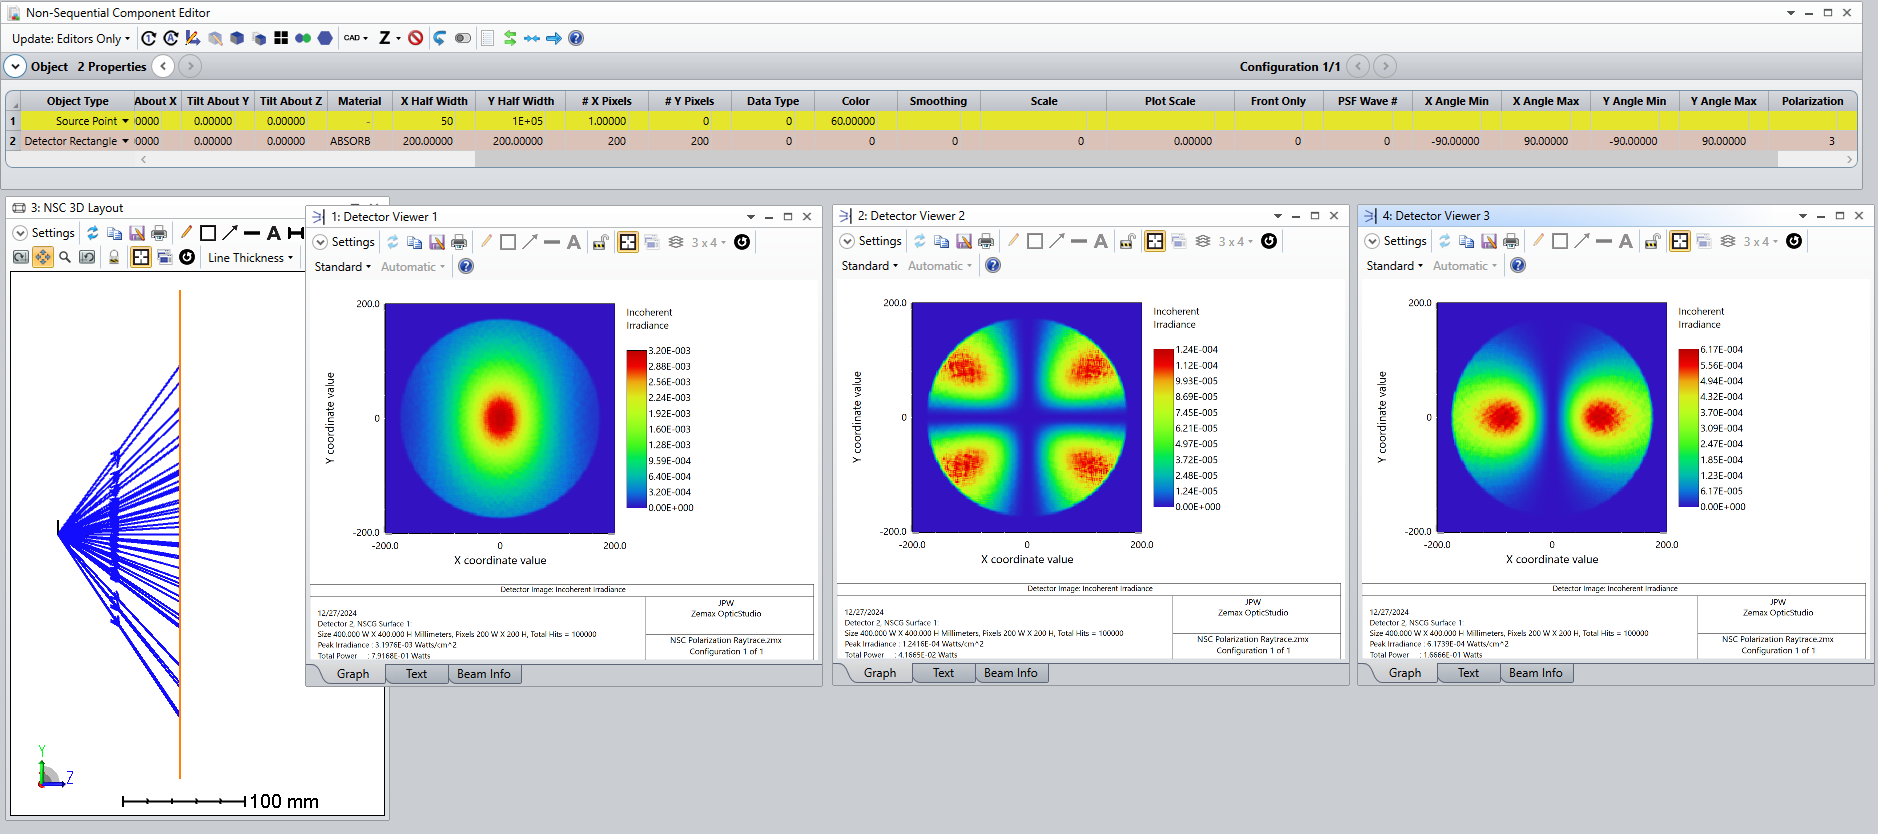
Maybe I don’t understand the details of your problem.  If your source is simply a point emitter, then in Zemax you can assign it a well-defined Jones polarization state.  In this case, all source rays will have the same Jones vector polarization relative to their corresponding k-vectors so that for each ray (Jx, Jy, k) are mutually orthogonal.  Therefore, a high-NA point source with a polarization of (Jx,Jy) will yield a spatially varying polarization state measured in the local coordinate system with field components (Ex, Ey, Ez).  Here is an example in non-sequential mode showing the E-field x, y & z components of an NA=0.6 beam from a point source with (Jx, Jy) = (1, 0) based on the default conversion method (x axis reference):


The same thing can be done for a custom source file (for your case, the ray intensities are defined as a function of direction cosines).  If this approach can work for you, then you can simply conduct a polarization ray trace and extract the output ray data (using, for example, the ZOS-API).  A similar thing can be done in sequential mode for a point source, but the angular variation of source ray intensities would have to be defined by using a custom apodization DLL (via a user-defined surface, or UDS); there are a number of examples provided.  Also, in sequential mode, you would have to import your STEP file inside a non-sequential surface, which effectively makes it a mixed-mode model.

If this single Jones vector description of a source doesn’t work for you, then I don’t see off hand how Zemax ray tracing can be used in the manner you desire.

Regards,

Jeff


Hi ​@Jeff.Wilde,

Thanks a lot for the provided information. After your comment I started reading the book “Polarized light and Optical Systems” from which I noticed that it is also possible to have non “global” polarization states across the incident wavefront surface. This is somehow my situation. In deed, I have a point emitter. However, the point emitter is embedded within some thin layers that result in variations for the polarization state along the wavefront surface. (As mentioned in my first comment, I do the modeling of my source via FDTD simulations).

From your comment, I understand that this type of “locally” varying polarization state definition would not be supported? i.e, I cannot explicitly set the polarization vector for each ray? 

Finally, from the mentioned book, they present a technique based on 3D polarization ray tracing which generalizes the use of Jones vector and matrices to the 3D case. Is this also the way polarization ray tracing is performed within Zemax? 


Reply