Solved

Off-Axis Field Coordinates

  • 15 July 2021
  • 6 replies
  • 861 views

Userlevel 1

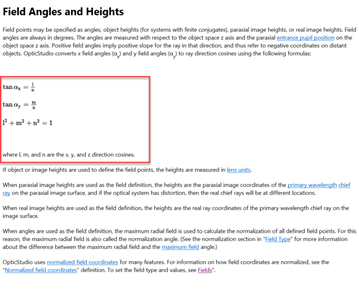
I have a model of a lens and want to look at the focal power at different field angles. I don't fully understand how the normalized field coordinates work for e.g. diagonal fields.


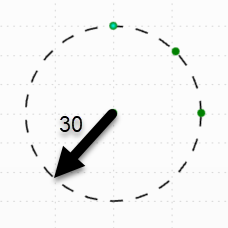
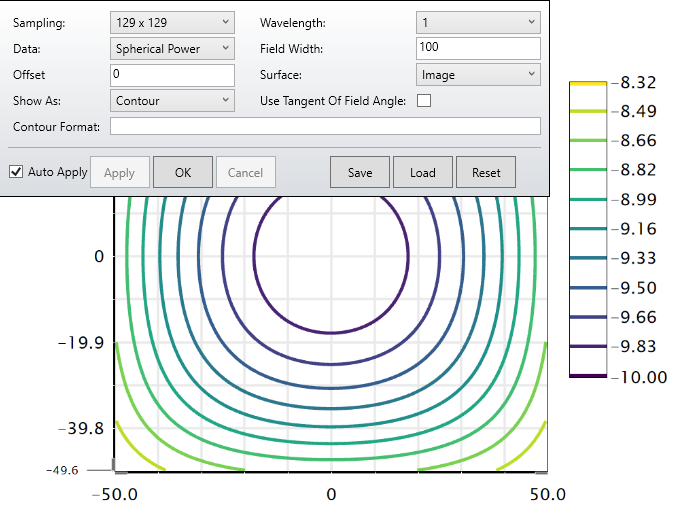
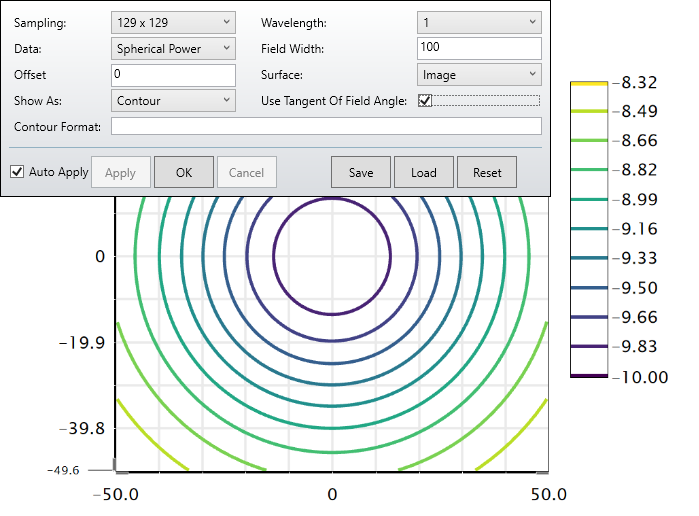
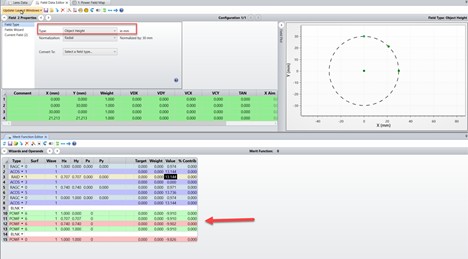
In the attachment, I have a simplified version with a spherical lens to illustrate the issue that I am seeing. I created 3 fields in the field data editor: (0°, 30°), (30°, 0°), (21.213°, 21.213°). The last field is a diagonal field coordinate with the amplitude 30° (30°/SQRT(2)=21.213°). I expect the focal power in each of the three field points to be identical, since the lens is rotationally symmetric. Indeed, the Power Field Map tool the contour lines for a fixed focal power seem to be circles.


However, next I evaluate the focal power for the different field points in the Merit Function. It turns out that at the normalized field coordinates (1, 0) and (0, 1), I get a focal power of -9.524 dpt. But at (0.707, 0.707), I get -9.563 dpt. To get to the same focal power that I get on axis, I need to pick the field coordinates (0.740, 0.740).


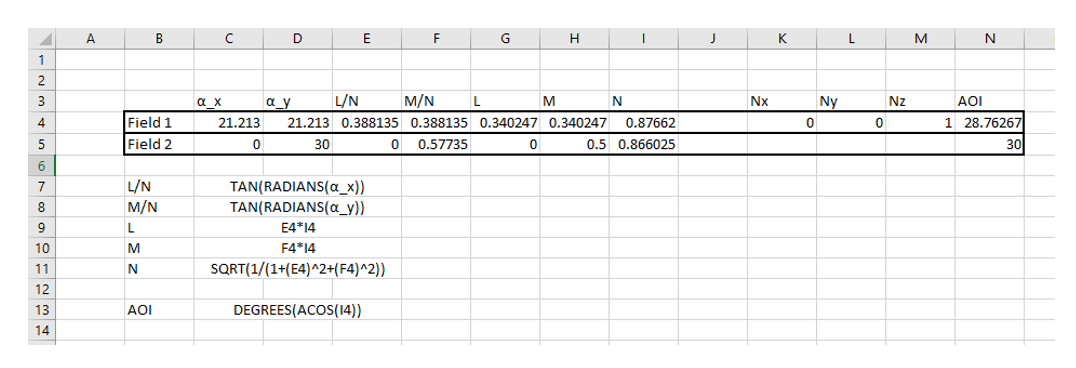
Also if I evaluate the field angle from the ray data (ACOS(RAGC)), the norm. field coordinate of (0.707, 0.707) gives 28.763°, instead of 30°.


Can someone explain to me why for the diagonal fields, the field amplitude is different? How do I calculate the field coordinate that is equivalent to (1, 0), but turned by 45°? What does the Power Field Map tool actually plot on the x and y axis - is it maximum field * normalized field coordinate?

icon

Best answer by Flurin Herren 19 July 2021, 14:49

View original

6 replies

Badge +3

Hi Erik,


Thank you for posting in the forum!


Very good question: The reason for that is the way how OpticStudio calculates Field Angles and Heights. Please allow me to elaborate.


In you case we have a Field angle of 30° as an amplitude and as 30/sqrt(2) = 21.213° is technically correct, if we look into the help File of the Field Data Editor:


Under “Field angles and heights” we can find the following calculations:


Applied on this case, we get: =DEGREES(ATAN(SQRT(TAN(RADIANS(30))^2/2))) à 22.20765°


  • 22.20765°/30° = 0.740255


That is also where your (0.740,0.740) coordinates are coming from.


On another note: What you also could do, is changing the Field type from Angle to Object Height. Like that we get the same value at 1/sqrt(2) (=0.707) therefore linear in object height


Applied on your case:


I hope I was able to help.


Have a good week,


Flurin


Userlevel 1

Hi Flurin,

thank you for your answer. It took me a bit of time to wrap my head around the issue, but I think I'm almost there now. Let me try to summarize and then I have a follow-up question:

It seems to me that the entire issue revolves around the fact that the ray is not in 2D but in 3D space. In the field data editor, we are defining the angles alpha_x = arctan(v_1/v_3) and alpha_y = arctan(v_2/v_3), correct? Now if I just calculate sqrt(alpha_x^2+alpha_y^2), I do not get alpha_z=alpha_3. That's where I was a bit mislead by the plot in the field data editor. (I understand though, that you provide this plot in analogy to the image heights, where indeed x^2+y^2=z^2.) The correct field angle alpha_z=alpha_3 is instead always given by cos(alpha_z)=v_3/|v|, which is the direction cosine (in Zemax: ACOS(RAGC)). It happens, that along the main axes, the field angle is alpha_z=alpha_x and alpha_z=alpha_y, for the respective cases.

Direction_angles_a.png(Plot is from wikipedia: Direction angles a - Richtungskosinus – Wikipedia)

Let me also put down the calculation of the formula that you posted (just to make sure, we are aligned - and for me to remember in the future):

l^2+m^2+n^2=1

(l/n)^2 + (m/n)^2 + 1 = tan^2(alpha_x) + tan^2(alpha_y) + 1 = 1/n^2 = 1/cos^2(alpha_z) = 1 + tan^2(alpha_z)

tan^2(alpha_x) + tan^2(alpha_y) = tan^2(alpha_z)

alpha_z = arctan(sqrt(tan^2(alpha_x) + tan^2(alpha_y)))

So far so good. What I'm not 100% clear about is what the power map tool is plotting. If I draw a circle in the plot, do I cover a line of constant alpha_z, or do I cover a line of constant alpha_x^2+alpha_y^2? Or in other words, does this tool account for the correct off-axis field angles, or is the plot equivalent to the plot in the field data editor?

Thank you for clarifying.

Best regards,

Erik

Badge +3

Hi Erik,
 
Hope you are doing well. Apologies that you had to wait over the weekend, we were really busy setting up our new fancy website.
 
Regarding your summery: I think you are spot on there, the best way to explain/understand it is to apply it to your optical system. So let`s do that!
Given this setup (Screenshot below) and the equations in the Help file "Field Angles and Heights"


If we now strictly stick to the angle rule and calculate Filed 1 (21.213, 21.213) and Field 2 (0, 30). We can observe a different angle of incident:
(I have also attached this picture in case you cant see it)
 

Regarding your question:
As a Basic term: The power map computes the optical power as a function of the field position. Therefore will the plot be equivalent to the plot in the field data editor, as we acquired in the posts before > If we apply Object Height in the Field Data editor instead of Angle, the Power Map will be different because the AOI will be calculated differently and is therefore on a solely coordinate standpoint of view also different.
Feel free to reach out again if I was unclear
 

Best,

Userlevel 1

Hi Flurin,

thank you for confirming the calculations. For the Power Field Map, I understand that if I set “Angle” as Field Type and turn “Use Tangent Of Field Angle” off, I get the equivalent field coordinates from the field editor plot. Hence, the contour lines are not round.

I realized, that per default the checkmark at “Use Tangent Of Field Angle” is set, which results in round contour lines with different spacing (note that the color scale is the same). Note that I cannot set Field Type to “Object Height” since my object is at infinity.

What is plotted in the second case? I still don’t understand what value Zemax calculates if I go, say to the coordinate (30, -40) in the second plot. In the first plot it is just the focal power at alpha_x=30° and alpha_y=-40°, but not in the second.

Best,

Erik

Badge +3

Hi Erik, 

Hope you are doing well! 

Regarding your second plot and especially the checkmark “Use Tangent Of Field Angle”:

If this box is ticket AND the field type is angle in degrees (This is your case, when I recall correctly), the displayed spatial distribution of the data is proportional to the tangent of the angle.

In your case it would be proportional of the tangent of the angle which is applied onto the field with the coordinate of (30,-40), that is the data of your second plot.

In contrast, if the box is unticked the data shown in the plot is proportional to the angle directly.

So here directly onto the angle of coordinate (30,-40).

I hope my explanation is comprehensible.

Please tell me if not and I will try to rephrase it or we can look at your example in a bit more detail,

Best,

Userlevel 1

Hi Flurin.

It’s all clear now. Thank you for your detailed explanations!

Best,

Erik

Reply