
What is the difference between the statistics for Monte Carlo analyses, and which one should I be using?

Solved
Monte Carlo Statistics
Best answer by Sarah.Grabowski
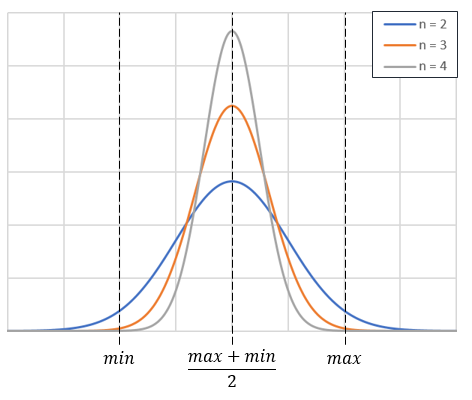
When running a Monte Carlo Analysis, each parameter that has a set tolerance will be assigned a value randomly in accordance with a statistical distribution over the range of possible values. There are 4 different types of statistical models you can use to define the distributions: normal, uniform, parabolic, or user defined. The normal statistics is a Gaussian distribution with a default width of four standard deviations between the minimum and maximum allowable values. A uniform distribution will select any value within the acceptable range with equal probability. The parabolic statistical distribution models the possible values with a parabola, thus favoring the ends of the range rather than the center like a Gaussian. And finally, a user defined statistical distribution is very flexible and can use measured statistical data, feature multiple peaks, show a skewed distribution, etc.
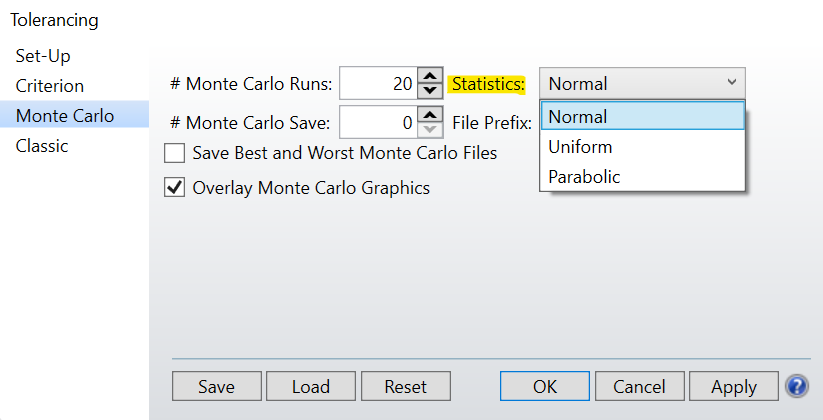
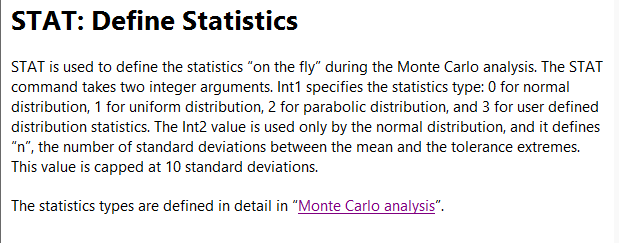
In the Monte Carlo tab of the Tolerancing window, you can change the type of statistics that are used during the tolerancing analysis, or you can set a different type of statistics for each tolerancing operand in the Tolerance Data Editor using the STAT command.
In the end, the type of statistics you should use depends on your design and how strictly you are tolerancing it. A normal distribution is the default setting and is optimistic that most of the manufactured parts will be closer to the nominal design. Using the uniform distribution or a parabolic distribution will give increasingly pessimistic results as the weight on the possible values shifts closer to the extremes, highlighting some of the more sensitive tolerances. However, because it expects parts to be further from the nominal values, using parabolic statistics may lead to a more rigorous design with a higher yield when the lenses is commercially produced. And finally, user defined statistics might be appropriate for a system where you are trying to mimic a specific production process in your tolerancing analysis. So while the default setting of a normal distribution may work for most projects, exploring your design with the other statistics may be insightful depending on how appropriate conservative tolerances are for your lens.

Enter your E-mail address. We'll send you an e-mail with instructions to reset your password.
Need more help?
To Chinese users:
Do not provide any information or data that is restricted by applicable law, including by the People’s Republic of China’s Cybersecurity and Data Security Laws ( e.g., Important Data, National Core Data, etc.).
不要提供任何受适用法律,包括中华人民共和国的网络安全和数据安全法限制的信息或数据(如重要数据、国家核心数据等)。