
Solved

Monte Carlo analysis of MTF

  • Nov 10, 2023 12:42 PM UTC
  • 2 replies
  • 494 views

When performing tolerancing on a system, ín particular a Monte Carlo analysis, the report provides a list of the criterium value (e.g. RMS spot radius) for each iteration. Recently ive come across a different type of analysis, where the full MTF function (for all defined fields) is drawn for each iteration, like in the figure below:
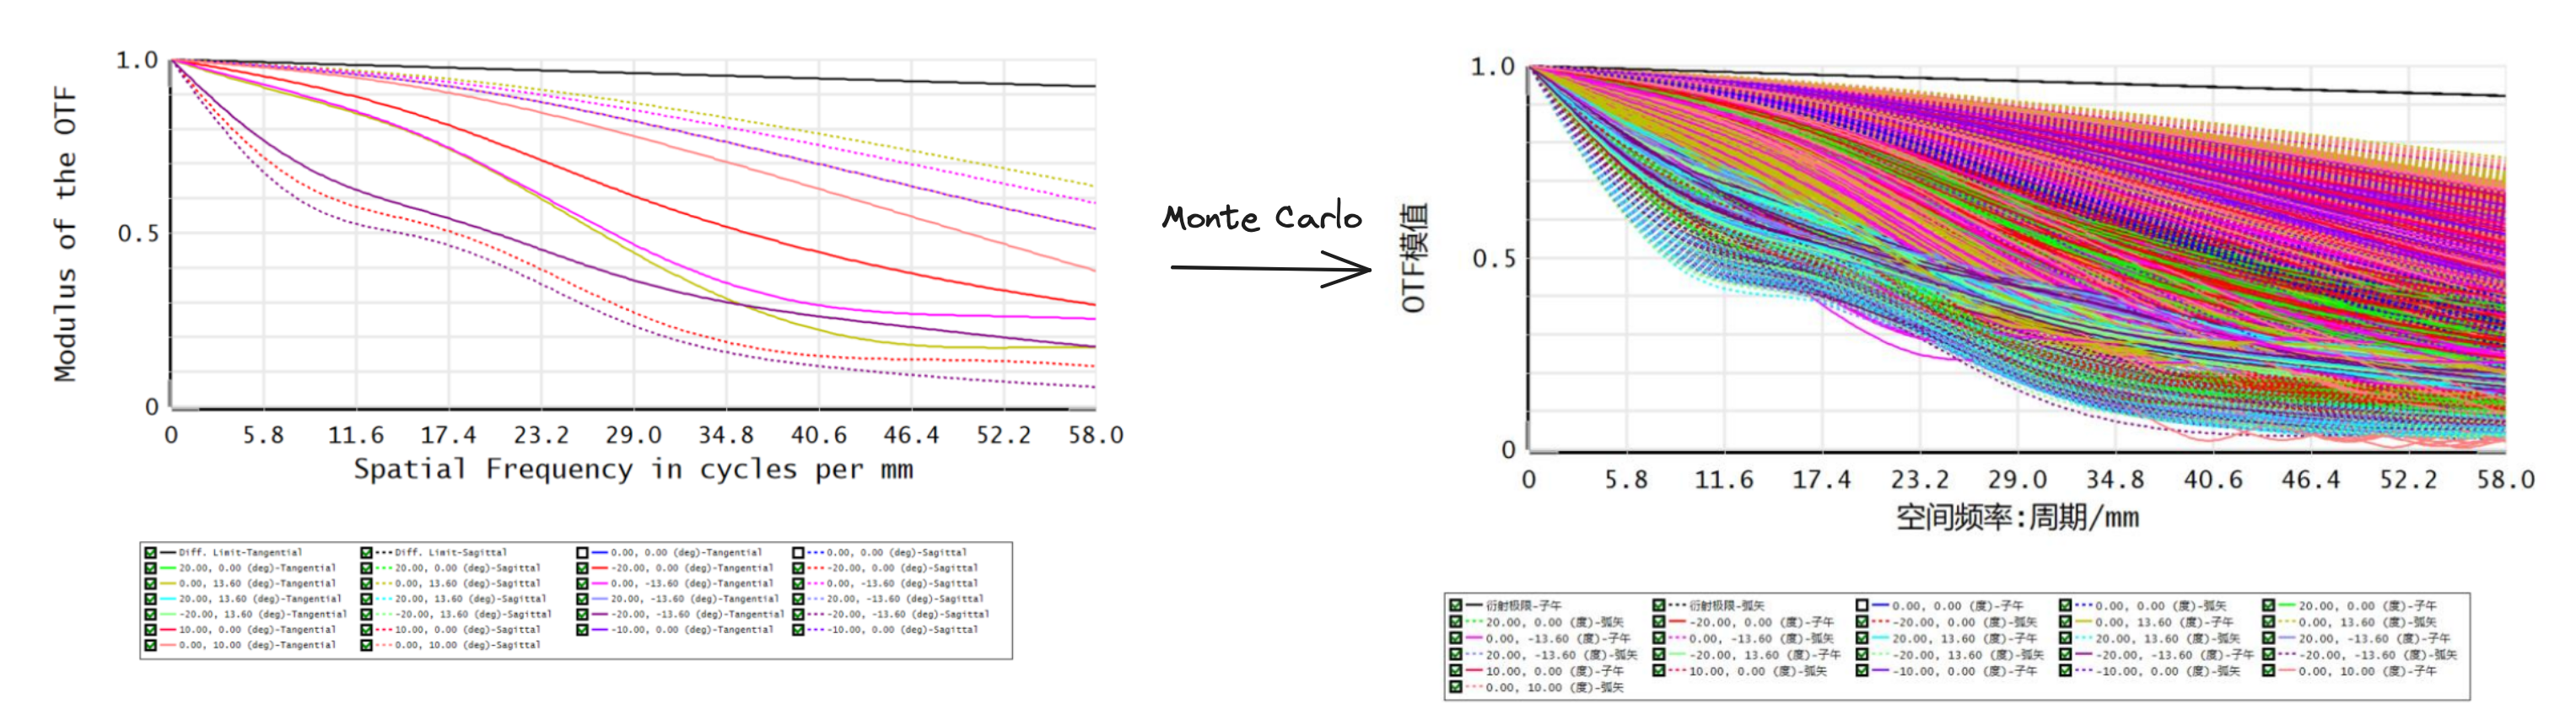
 

Can you elucidate how to execute this analysis?

Kind regards
Best answer by Andrey.Pravdivtsev

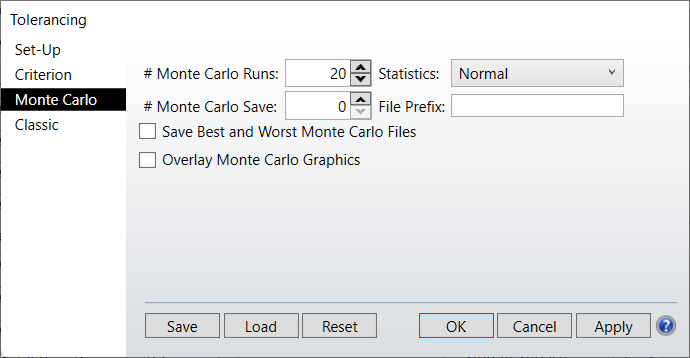
Create a MTF layout and use check bok “Overlay Monte Carlo Graphics” in Tolerance settings.


View original

2 replies

Forum|alt.badge.img

Create a MTF layout and use check bok “Overlay Monte Carlo Graphics” in Tolerance settings.


  • Author
  • Visible
  • Nov 13, 2023 5:10 PM UTC

Thank you for the indication!