Hi,
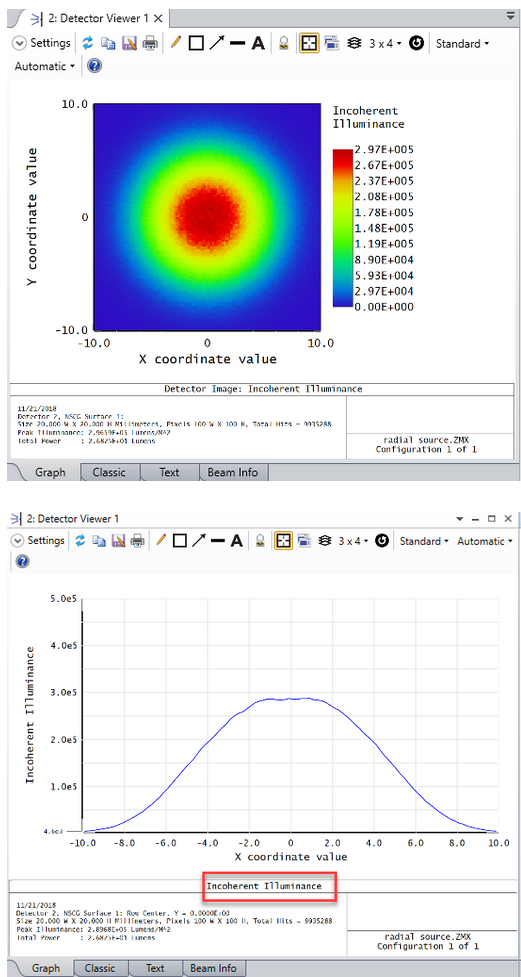
I have a rather simple question, how do I create a cross section of a plot in the detector viewer?
In the image below, top is the illuminance plot and on the bottom is a cross section at y=0.
How do I create such a plot with a cross section?

Thank you and best wishes

