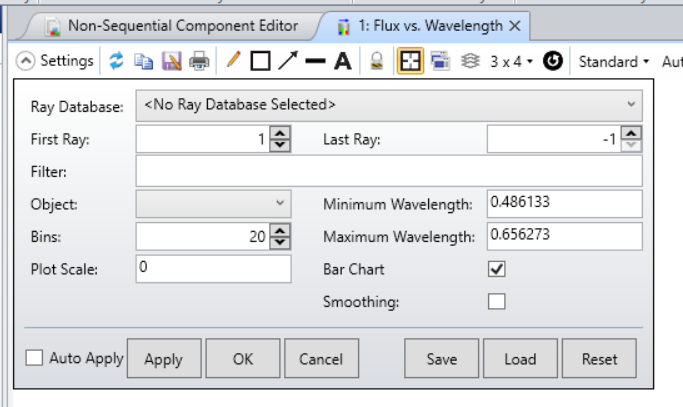
Hi Everyone,
I am trying to obtain reflectivity/ scatter vs wavelength plot for surfaces with different coating, colors and smoothness/ roughness (something like attached capture.jpg). Using zemax when I apply a particular coating, I can get its reflectivity, absorption, and transmission with respect to wavelength range (analyses→ coating→ reflection vs wavelength) but when I am applying scattering function this object, there is no change in the observed graph from coating analysis (analyses→ coating→ reflection vs wavelength), see fig 11 and 123 for reference.
How can I get a graph over range of wavelength that in cooperates the effects of both scattering and coating similar to capture.jpg??
Also wants to confirm that if I would assume a detector at source and at the object then by using= I_Source/I_object I can at-least obtain an average value of reflectivity for a given coating and scattering??
Apologies if I missed anything, I am relatively new to the zemax, just trying to get this done for urgent work deadline.
Thanks in advance!


