Solved

Footprint Diagram Ray min and max values


Badge

In the Footprint Diagram Analysis Feature, the maximum and minimum ray X and Y dimensions are provided on the plot.  Is there a way to access these same values from the merit function?  I would like to know the maximum ray X and Y coordinates for each applied tolerance and monte carlo file, without having to refresh the Footprint Diagram window for every change.  Thank you

icon

Best answer by David.Nguyen 20 April 2021, 12:32

View original

11 replies

Userlevel 7
Badge +2

Hi Taylor,


I don't think the operand exists readily. However, this is something you can achieve with a user-defined operand.


Here is how it would look like, and I'm going to link my files, and give you a description of the code, which is given as it is, and I do not take responsibility for anything that it outputs.


The user operand is called UDOC03.exe, therefore you should specify a UDOC operand with Prog# equal to 3. The Data parameter is used to change between the different values: 0 = X Min | 1 = X Max | 2 = Y Min | 3 = Y Max.


The idea behind the operand is to run a footprint diagram in the background, save the results to a text file (since the results of this analysis window haven't been implemented in the ZOS-API yet), and read this text file before display in the MFE.


The C# code is as follow (EDIT: I updated the code to handle scientific notation, but I couldn't update my archive attached to this thread, please use the link to the GitHUB repository):


// Create a footprint diagram analysis window
            footprint_diagram = TheSystem.Analyses.New_Analysis(ZOSAPI.Analysis.AnalysisIDM.FootprintSettings);
            // Apply settings and update analysis
            footprint_diagram.ApplyAndWaitForCompletion();
            // Retrieve settings from the analysis window and write to a text file
            string temporary_filename = @'Footprint_diagram_results.txt';
            string full_path = Path.Combine(TheApplication.SamplesDir, temporary_filename);
            footprint_diagram_results = footprint_diagram.GetResults();
            footprint_diagram_results.GetTextFile(full_path);
            // Parse the text file
            string new_line = '';
            StreamReader sr = new StreamReader(full_path);
            // Ignore header
            for(int ii=0; ii < 8; ii++)
            {
                new_line = sr.ReadLine();
            }
            // Scientific notation regex
            string sci_regex = @'-?[\d.]+(?:E-?\d+)?';
            // Get X min
            new_line = sr.ReadLine();
            string str_value = Regex.Match(new_line, sci_regex).Value;
            double x_min = Convert.ToDouble(str_value);
            // Get X max
            new_line = sr.ReadLine();
            str_value = Regex.Match(new_line, sci_regex).Value;
            double x_max = Convert.ToDouble(str_value);
            // Get Y min
            new_line = sr.ReadLine();
            str_value = Regex.Match(new_line, sci_regex).Value;
            double y_min = Convert.ToDouble(str_value);
            // Get Y max
            new_line = sr.ReadLine();
            str_value = Regex.Match(new_line, sci_regex).Value;
            double y_max = Convert.ToDouble(str_value);
            sr.Close();
            File.Delete(full_path);
            operandResults[0] = x_min;
            operandResults[1] = x_max;
            operandResults[2] = y_min;
            operandResults[3] = y_max;

And you'll find my example archive file (which contains the UDOC, and will install it automatically, and by install it, I mean it'll copy it to your Documents\Zemax\ZOS-API\Operands folder) attached to this answer.


Please study this code, and be aware that I did not do any error handling, and I did not thoroughly tested it. It is given as it is and I don't take any responsibility with respect to what it outputs. Best would be for you to re-implement it once you understand my code. Let me know if this helps.


Take care,


David

Userlevel 7
Badge +3

That's s super bit of code there David! It does seem like a lot of work to get just four numbers however. Assuming that the max and min occur along the x and y-axes, a quicker way would be to trace four marginal rays at 12, 3, 6 and 9 o'clock. For each ray, test to see if it is vignetted, and if so tighten the pupil coordinate until you get the first ray that successfully traces. Rinse and repeat, and you'll get the four data points you need.


Mind you, since David has written the code, that's probably the fastest way in any case :-)

Userlevel 7
Badge +2

Hi Mark,


Thanks for the kind words.


I knew that one day my inclination towards programatic solutions might make me miss a more obvious solution :D


Take care,


David

Badge

Wow David, thank you!  That code is exactly what I need.  The geometries of my footrpints on the particular surface I am interested in are complex, and so I couldn't figure out a way to get what I needed with just tracing rays.


Quick question: How can I specify the surface over which to run the Footprint Digram?  And can I change any of the other settings like Ray Density and Wavelengths and Fields?


Sincerely,


Taylor

Userlevel 7
Badge +2

Dear Taylor,


My pleasure.


It is possible to specify different settings, but it is not straightforward as this analysis window is not fully implemented in the ZOS-API yet. I think the developers at Zemax are constantly working on implementing all the existing features, but it takes time.


Let me show you how I would do it for the Surface, and I'll let you adapt the code for the other settings.


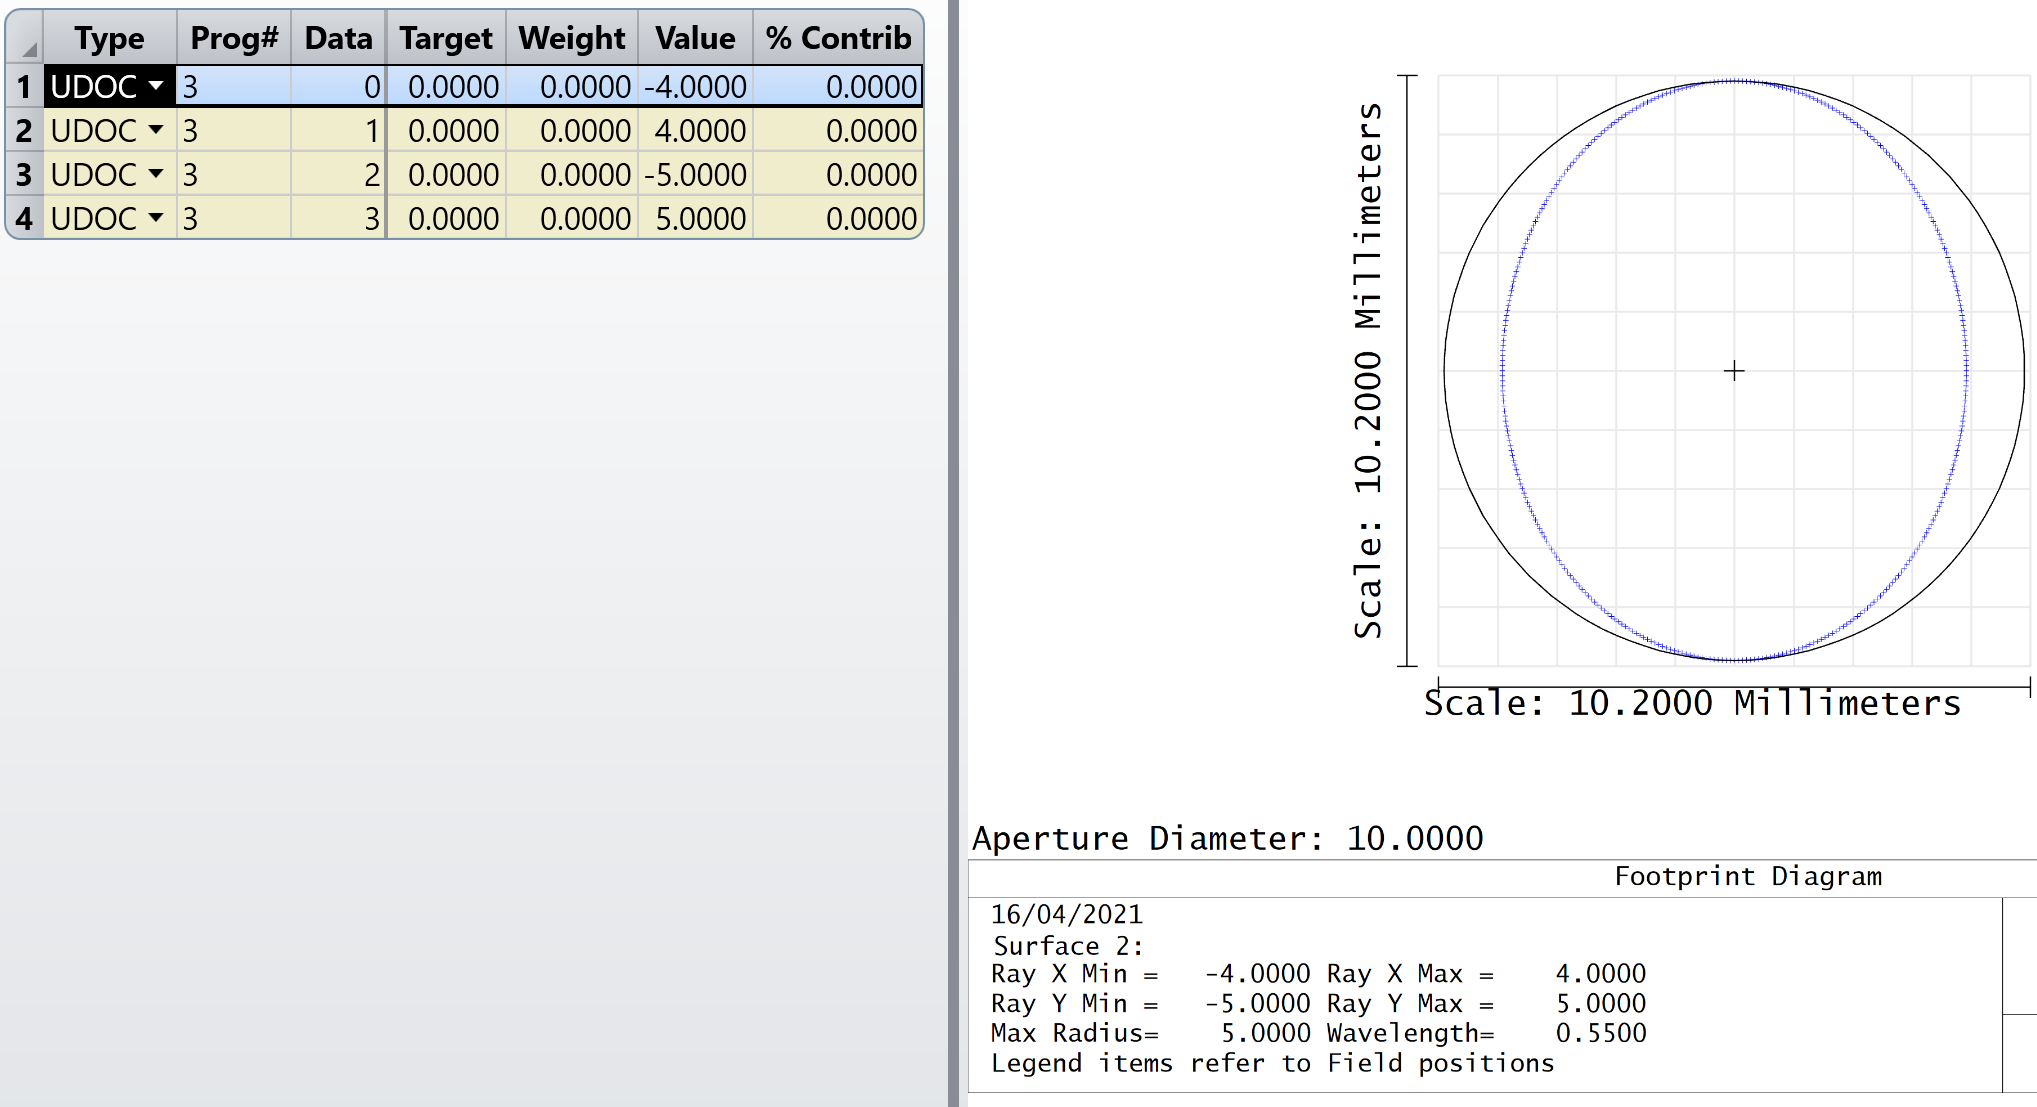
First, here is how the final result look like:


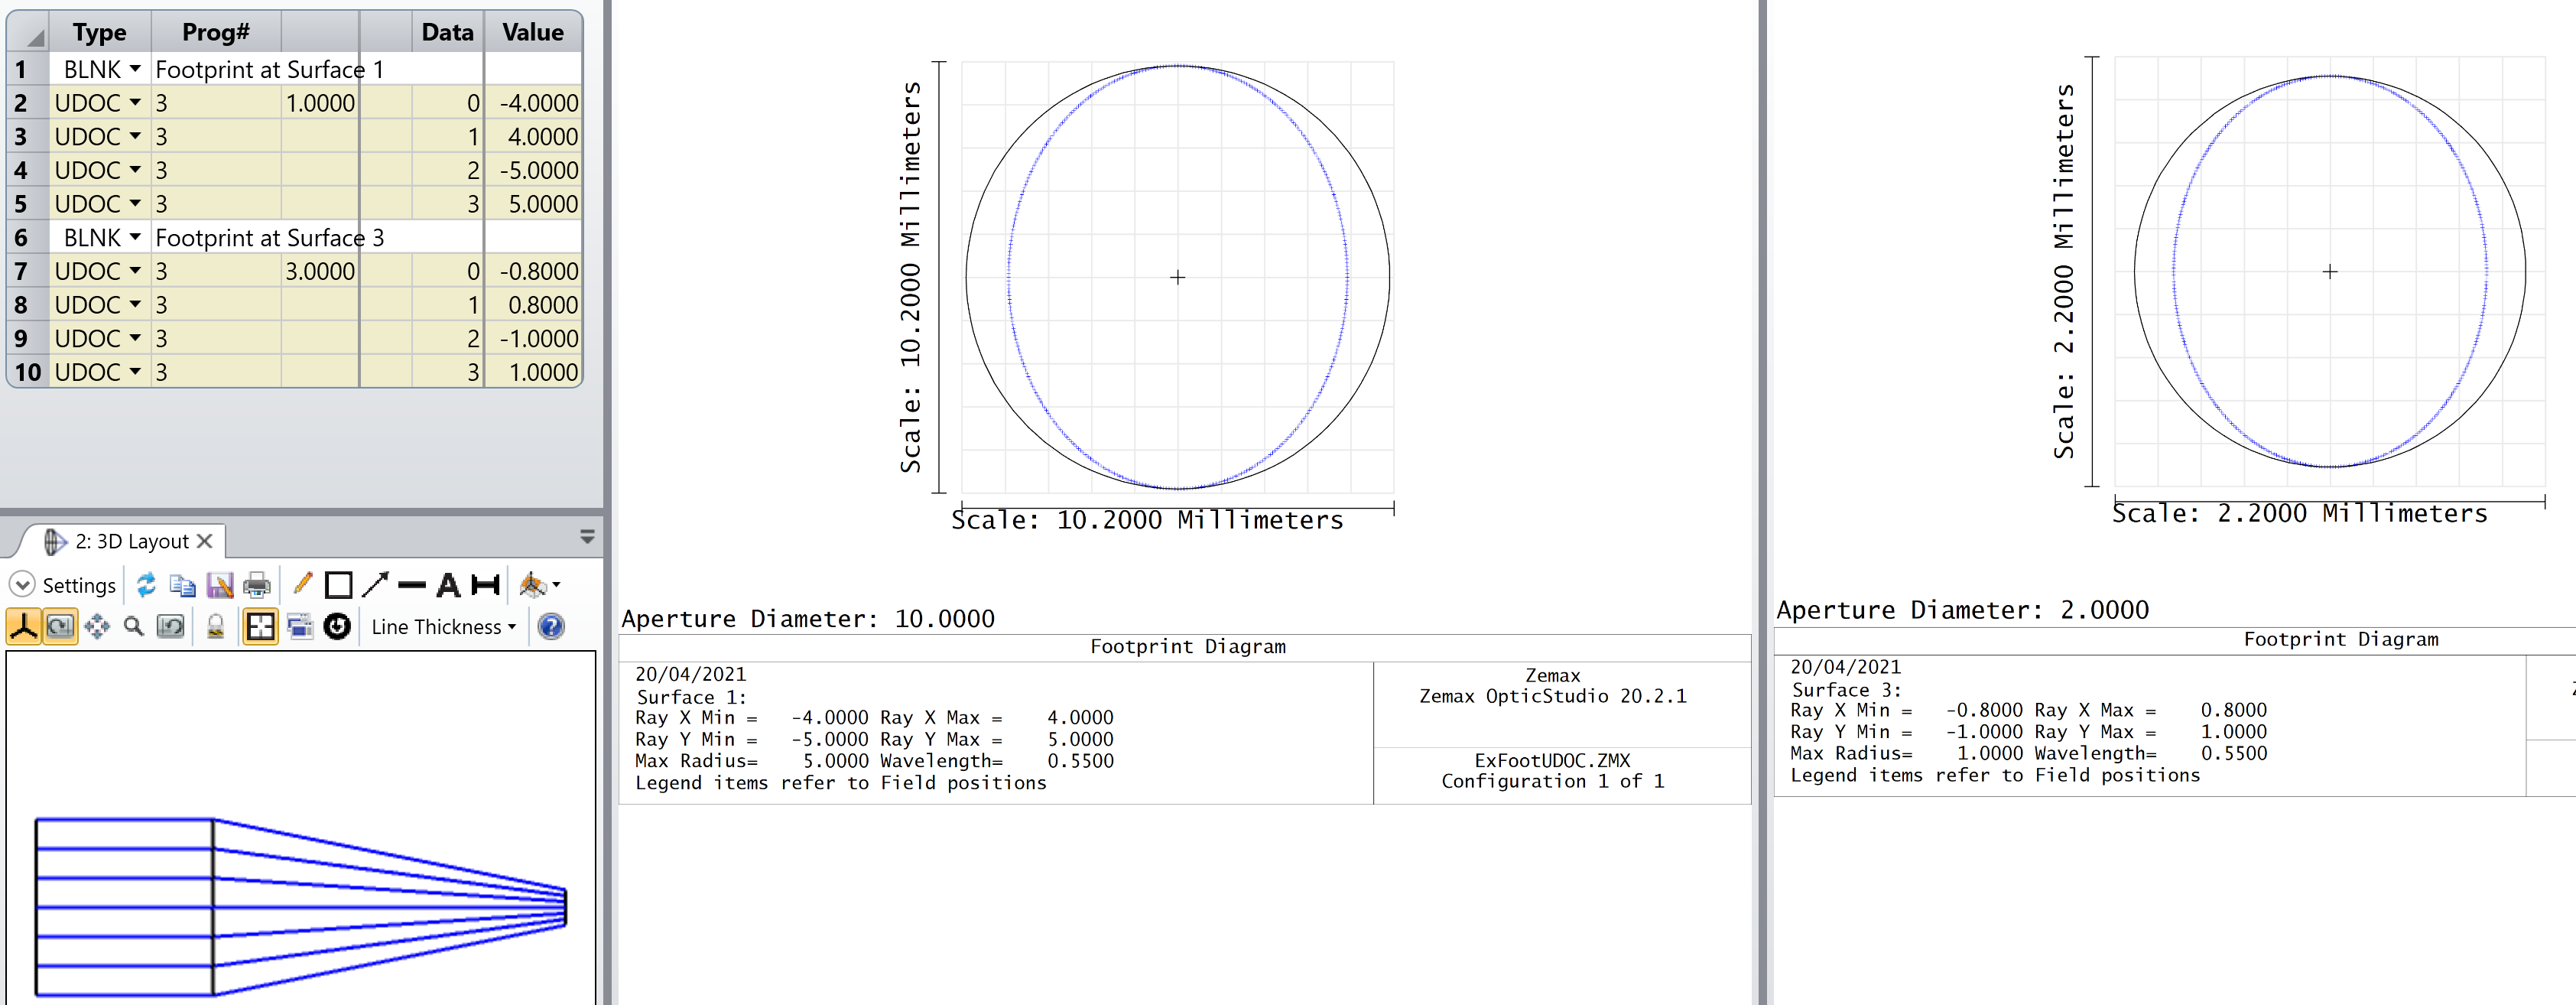
The idea is to use the Hx parameter of the UDOC operand to specify the Surface where you want your Footprint diagram.


The code needs to create a *.CFG file, which contains the settings of the Footprint Diagram, update the file with the correct surface number, and apply the changes before reading the values.


You can find the code here on my GitHub. The new part is in lines 85-97. As you can see, I made it such that any values of Hx below zero would use the default settings. Once again, there's no error trapping, and if you put a floating point value in Hx, it will probably truncate it. Also, in making the modification, I noticed my code wasn't reading scientific notation correctly. I've updated the REGEX expression in line 119 to correct it.


You can use Hy, Px, and Py to define other settings of the Footprint Diagram. The string codes for the Footprint Diagram can be found in the Help File under: The Programming Tab > About the ZPL > KEYWORDS (about the zpl) > MODIFYSETTINGS (keywords). I'm also copying it here for your reference:


FOO_RAYDENSITY: The ray density. Use 0 for ring, 1 for 10, 2 for 15, 3 for 20 etc.
FOO_SURFACE: The surface number.
FOO_FIELD: The field number.
FOO_WAVELENGTH: The wavelength number.
FOO_DELETEVIGNETTED: Delete vignetted, use 0 for no, 1 for yes.

As you can see, there are 5 settings, which can be changed, but only four parameters in the UDOC (Hx, Hy, Px, Py). However, this is not a problem. What you can do is encode the information in the number you pass to the UDOC. For example, you could use Hx for the Surface, and Field number. You could send a value 20006, and you could read the value 2 as the surface number, and the value 6 as the field number, for example.


Let me know if this makes sense.


Take care,


David

Userlevel 7
Badge +2

And here is the new archive :)

Badge

Awesome, makes sense to me.


Thanks again!

Badge

Although I just ran into my first problem!


When I use the User defined operands in a tolerance run, the original surface number that I entered into Hx is no longer valid when the tolerance run automatically adds in coordinate breaks and therefore changes all of the surface numbering.  Darn!

Userlevel 4
Badge +2

Wao! David, that is such great work!


I'll offer you a kombucha to thank you anytime :)


Taylor, I suggest you input the coordinate break yourself, [or use the TDE to create a specific file only for the purpose of tolerancing]


Then, you use TU** operands [which are using your own Coordinate Breaks, and doesn't create new ones]


That way, the surface number won't change during tolerancing.

Userlevel 7
Badge +2

Hey Thomas,


Thanks for your message. You know my weakness it seems. I'm looking forward to meeting you again.


I was about to suggest the same thing actually. Its a bit more work, but what you can do is open a Best/Worst Monte Carlo Run, it'll have the Coordinate Breaks your file need to get started.


Take care,


David

Badge

Good suggestions Thomas and David.  I'll do that!


Taylor

Reply