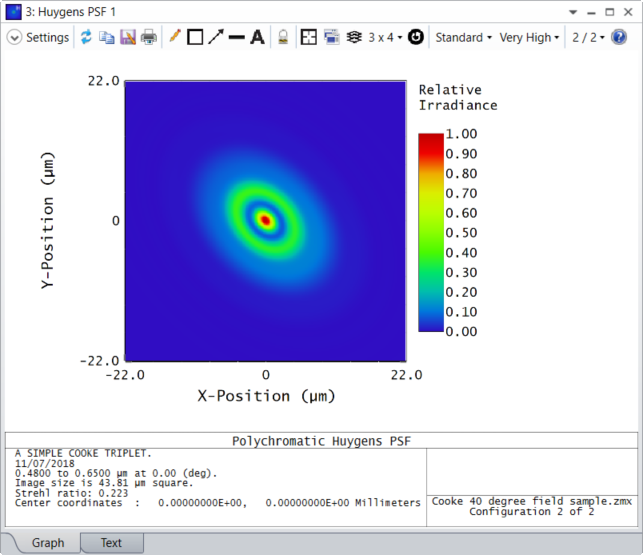
I want to create a universal plot of Huygens PSF FWHM vs wavelength or field. Is there an operand that would make this possible or do I need to write a script to (or manually) extract the FWHM from the Huygens plot data? This is for a spectrometer.
I’d also like to get the local dispersion around a number of central wavelengths. If you can think of any built-in tools or shortcuts for doing this, please let me know. Thanks!

Question
Extracting FWHM from Huygens PSF cross section
 +1
+1
Enter your E-mail address. We'll send you an e-mail with instructions to reset your password.
Need more help?
To Chinese users:
Do not provide any information or data that is restricted by applicable law, including by the People’s Republic of China’s Cybersecurity and Data Security Laws ( e.g., Important Data, National Core Data, etc.).
不要提供任何受适用法律,包括中华人民共和国的网络安全和数据安全法限制的信息或数据(如重要数据、国家核心数据等)。