What I’m really trying to do is show the MTF in object space (what I would get if I reversed the lens and plotted MTF). I believe all I need to do is scale the cycles/mm axis by the magnification. Not sure how to do that without exporting the data to some other application. Can it be done in ZPL alone?

Solved
Easiest way to scale x-axis values in MTF plots?
 +1
+1Best answer by Jeff.Wilde
I don’t know of any way to simply replace the x-axis data in a standard analysis plot window. However, you could try the following. Use a pair of paraxial lenses following your image plane to implement a magnification change (via the ratio of the lens focal lengths).
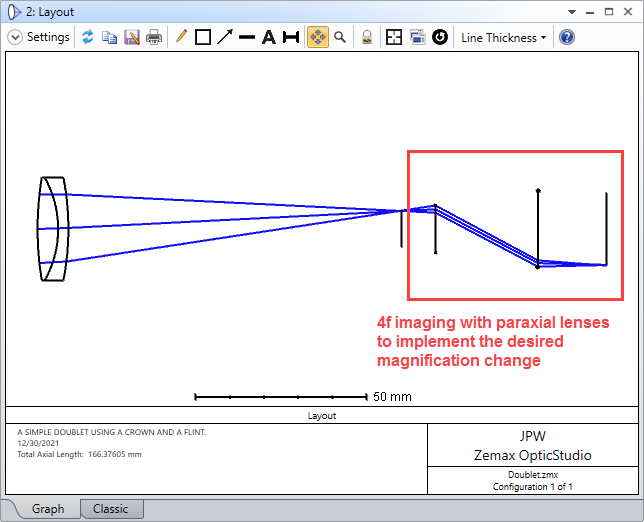
Then the MTF frequencies scale accordingly. Here’s an example with a 2X magnification adjustment:
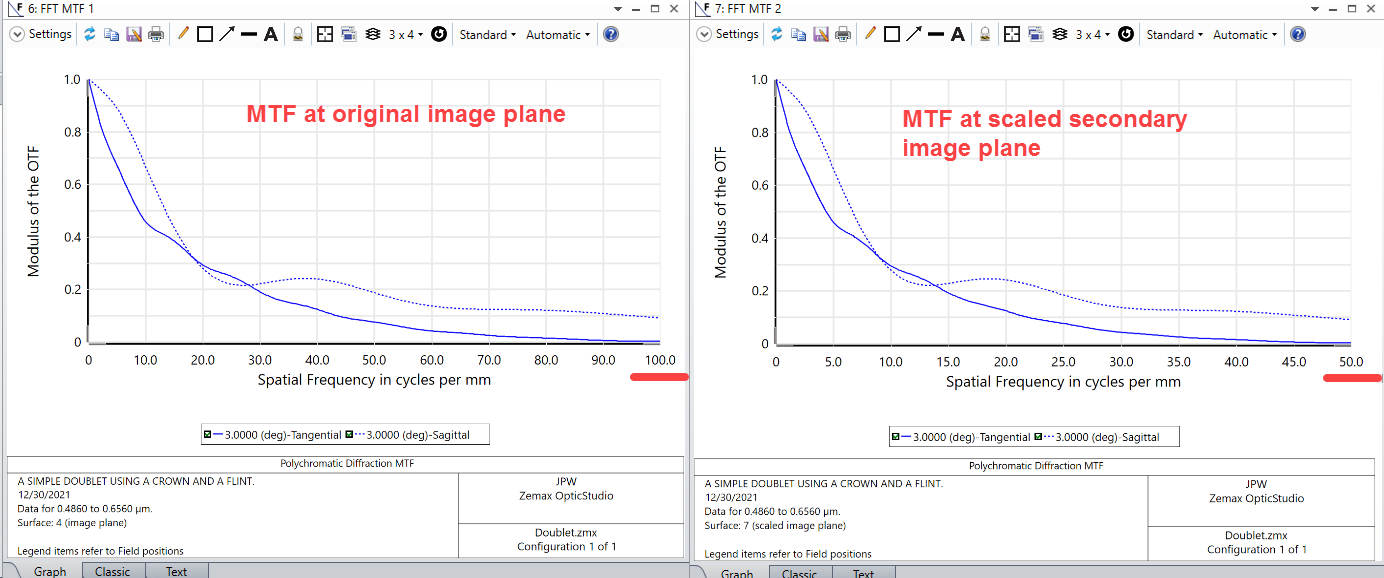
In the first graph the surface is chosen as the original image surface, while the second graph uses the new (magnified) image plane. It’s very simple and doesn’t require any programming.
Enter your E-mail address. We'll send you an e-mail with instructions to reset your password.
Need more help?
To Chinese users:
Do not provide any information or data that is restricted by applicable law, including by the People’s Republic of China’s Cybersecurity and Data Security Laws ( e.g., Important Data, National Core Data, etc.).
不要提供任何受适用法律,包括中华人民共和国的网络安全和数据安全法限制的信息或数据(如重要数据、国家核心数据等)。