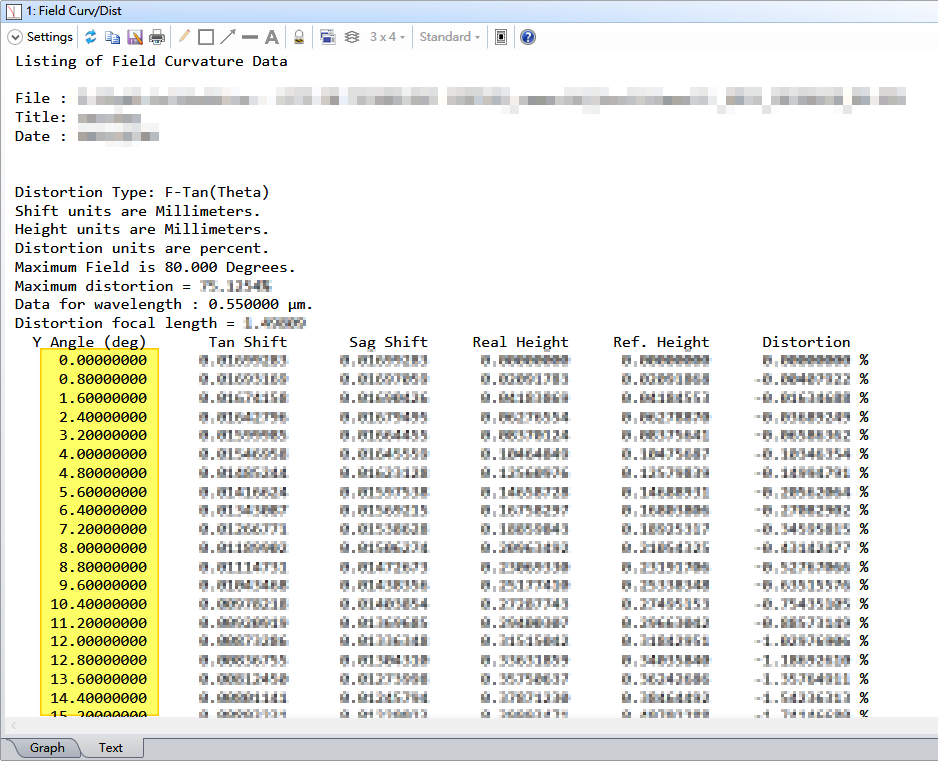
The "Y angle" interval is 0.8 (degrees), as shown in the figure below. But I want to get the data "Y angle" interval is 0.1 (degree).
The maximum field keeps 80.0 degrees.
How can I get the data "Y angle" interval is 0.1 (degree)?
Thank you!
Anna
Best answer by Mark.Nicholson
Hey Anna,
The FC/D plot does not let you select the data interval, so if you need the data on some specific grid you’ll need to write a macro. I’d probably use the DISG operand to compute the distortion at the desired field.
The FC/D plot does not let you select the data interval, so if you need the data on some specific grid you’ll need to write a macro. I’d probably use the DISG operand to compute the distortion at the desired field.
We use 3 different kinds of cookies. You can choose which cookies you want to accept. We need basic cookies to make this site work, therefore these are the minimum you can select. Learn more about our cookies.