I am looking to create a narrow band filters in NSC mode. They are roughly a 850 nm centre wavelength with a +/- 40 nm spread (cut on at 820 nm , cut off at 900 nm).
How can I define this in zemax - is it a custom coating? Or is there a simple way to do this?
Best answer by David.Nguyen
Hi Craig,
You could use a TABLE coating. To define your coating:
Press Library..Coatings Tool..Edit Coating File
Save a new coatings catalog (recommended)
Navigate to the TABLE section, you can do that by using the magnifier Find text in the toolbar of the coating window and searching for TABLE. There, you’ll have the definition of TABLE coatings, which is also available in the Help File under The Libraries Tab > Coatings Group > Defining Coatings > The TABLE Data Section
Type your coating definition
In your particular case, I would type something like so
TABLE NARROWBAND

ANGL 0.0

WAVE 0.820 1.0 1.0 0.0 0.0 0.0 0.0 0.0 0.0

WAVE 0.821 0.0 0.0 1.0 1.0 0.0 0.0 0.0 0.0

WAVE 0.899 0.0 0.0 1.0 1.0 0.0 0.0 0.0 0.0

WAVE 0.900 1.0 1.0 0.0 0.0 0.0 0.0 0.0 0.0
OpticStudio does a linear interpolation between the points you have defined, and it uses the closest point when outside the range (it does not extrapolate). I’ve done it for a single angle, don’t forget to add your data if you have an angular dependency.
Then, you can:
Save the coating file using the floppy icon
Press Library..Coatings Tool..Reload Coating File
In your NSC file, you can add a Rectangular Volume, and apply the coating to its front face. Note that you need a volume to apply a coating, you cannot apply a coating to a surface like the Rectangle object.
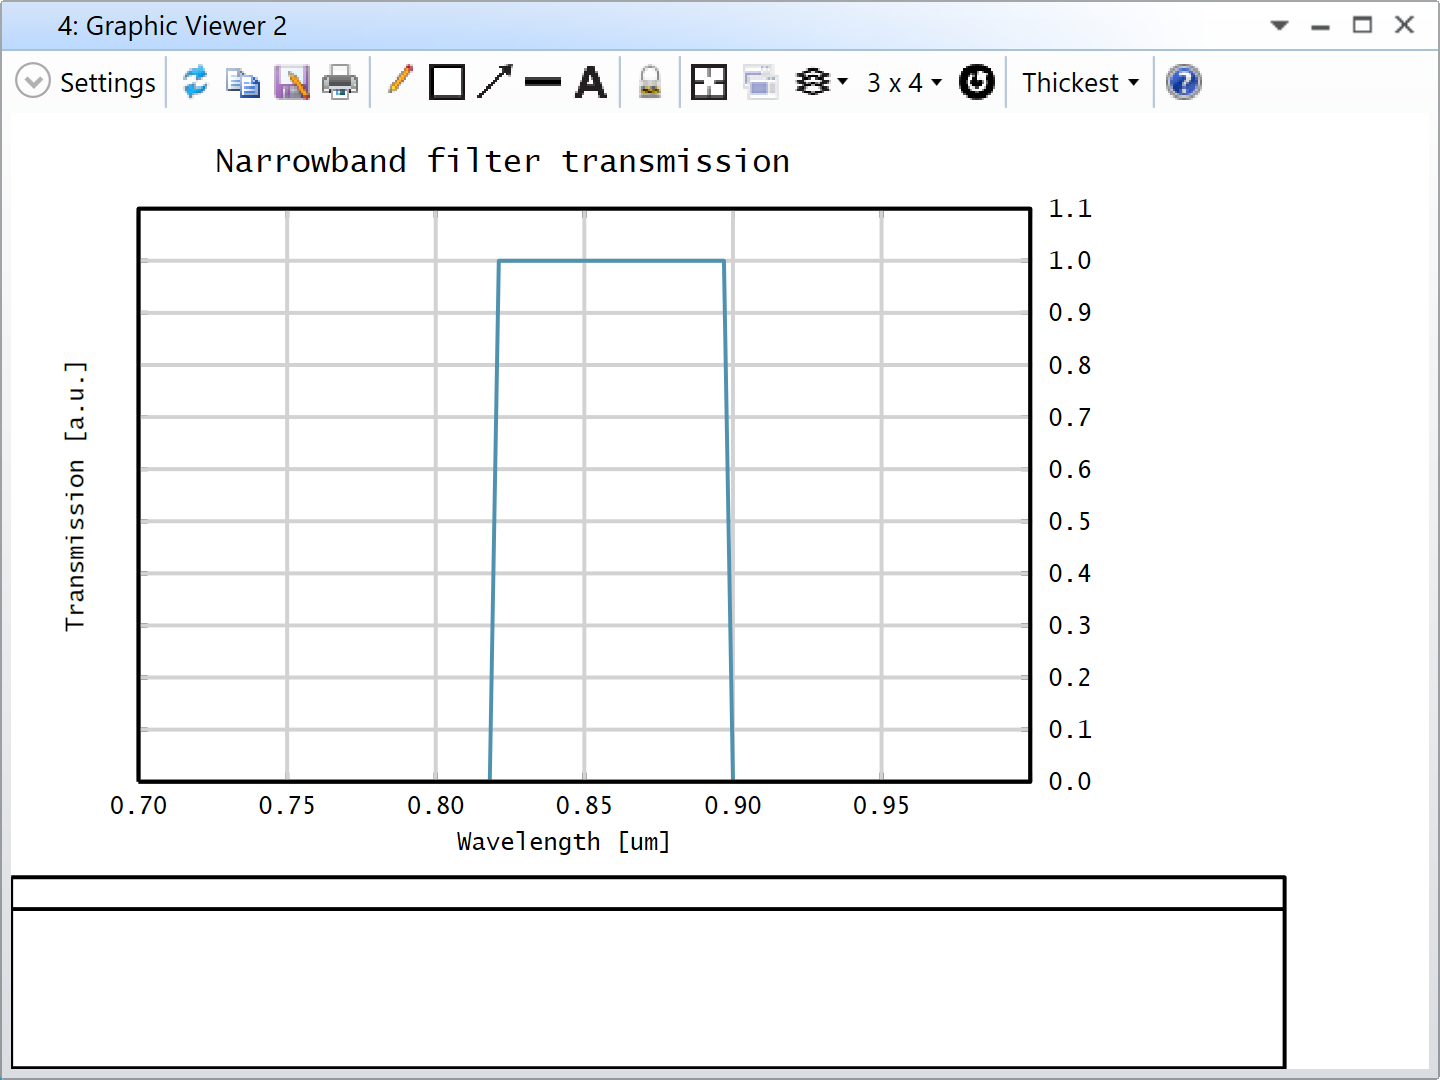
I’m attaching a file demonstrating my answer with a small macro to display the transmission curve of the filter.
The results looks like below:
I’m assuming you are familiar with macros, should you have an issue with what I wrote, please let me know.
You could use a TABLE coating. To define your coating:
Press Library..Coatings Tool..Edit Coating File
Save a new coatings catalog (recommended)
Navigate to the TABLE section, you can do that by using the magnifier Find text in the toolbar of the coating window and searching for TABLE. There, you’ll have the definition of TABLE coatings, which is also available in the Help File under The Libraries Tab > Coatings Group > Defining Coatings > The TABLE Data Section
Type your coating definition
In your particular case, I would type something like so
TABLE NARROWBAND

ANGL 0.0

WAVE 0.820 1.0 1.0 0.0 0.0 0.0 0.0 0.0 0.0

WAVE 0.821 0.0 0.0 1.0 1.0 0.0 0.0 0.0 0.0

WAVE 0.899 0.0 0.0 1.0 1.0 0.0 0.0 0.0 0.0

WAVE 0.900 1.0 1.0 0.0 0.0 0.0 0.0 0.0 0.0
OpticStudio does a linear interpolation between the points you have defined, and it uses the closest point when outside the range (it does not extrapolate). I’ve done it for a single angle, don’t forget to add your data if you have an angular dependency.
Then, you can:
Save the coating file using the floppy icon
Press Library..Coatings Tool..Reload Coating File
In your NSC file, you can add a Rectangular Volume, and apply the coating to its front face. Note that you need a volume to apply a coating, you cannot apply a coating to a surface like the Rectangle object.
I’m attaching a file demonstrating my answer with a small macro to display the transmission curve of the filter.
The results looks like below:
I’m assuming you are familiar with macros, should you have an issue with what I wrote, please let me know.
Thanks for your help - that’s just what I am looking for.
I’m not as familiar with macros as I’d like, so to view a specific transmission curve (like the ones I’ve created) - what will I need to change in the code?
There’s a first bit for initialization (before the FOR, NEXT loop), where you can specify the number of wavelengths to evalutae, n_waves, the starting/ending wavelengths in micrometres, start_wave/end_wave. Then, two arrays are initialized, they’ll contain the value pairs wavelength [um] and transmission [-]. In the FOR, NEXT loop, we calculate the wavelength at each iteration and use the SYSP keyword to change it in the System Explorer. Then, we clear all detectors, and run a raytrace, you can change the parameters of NSTR based on this format:
If save and subsequent parameters are ignored, they are simply not used, but I leave it to you to check the Help File for more details.
Finally, after the raytrace, we use the Numeric Function NSDD, which works like the NSDD Merit Function operand, to read the single pixel value of the detector. Since the detector has 1 pixel, and we send 1 ray at 0 degree incidence with 1 watt, we can assume it is like the transmission. If we measure 1 watt, it is transmission = 1.0 and if we measure 0.5 watt, transmission = 0.5, and we plot the graph.
Let me know if this makes sense and if you have any more specific questions.