I’m a new user of Zeman and I need to simulate a simple experimental set-up. The system is composed by:
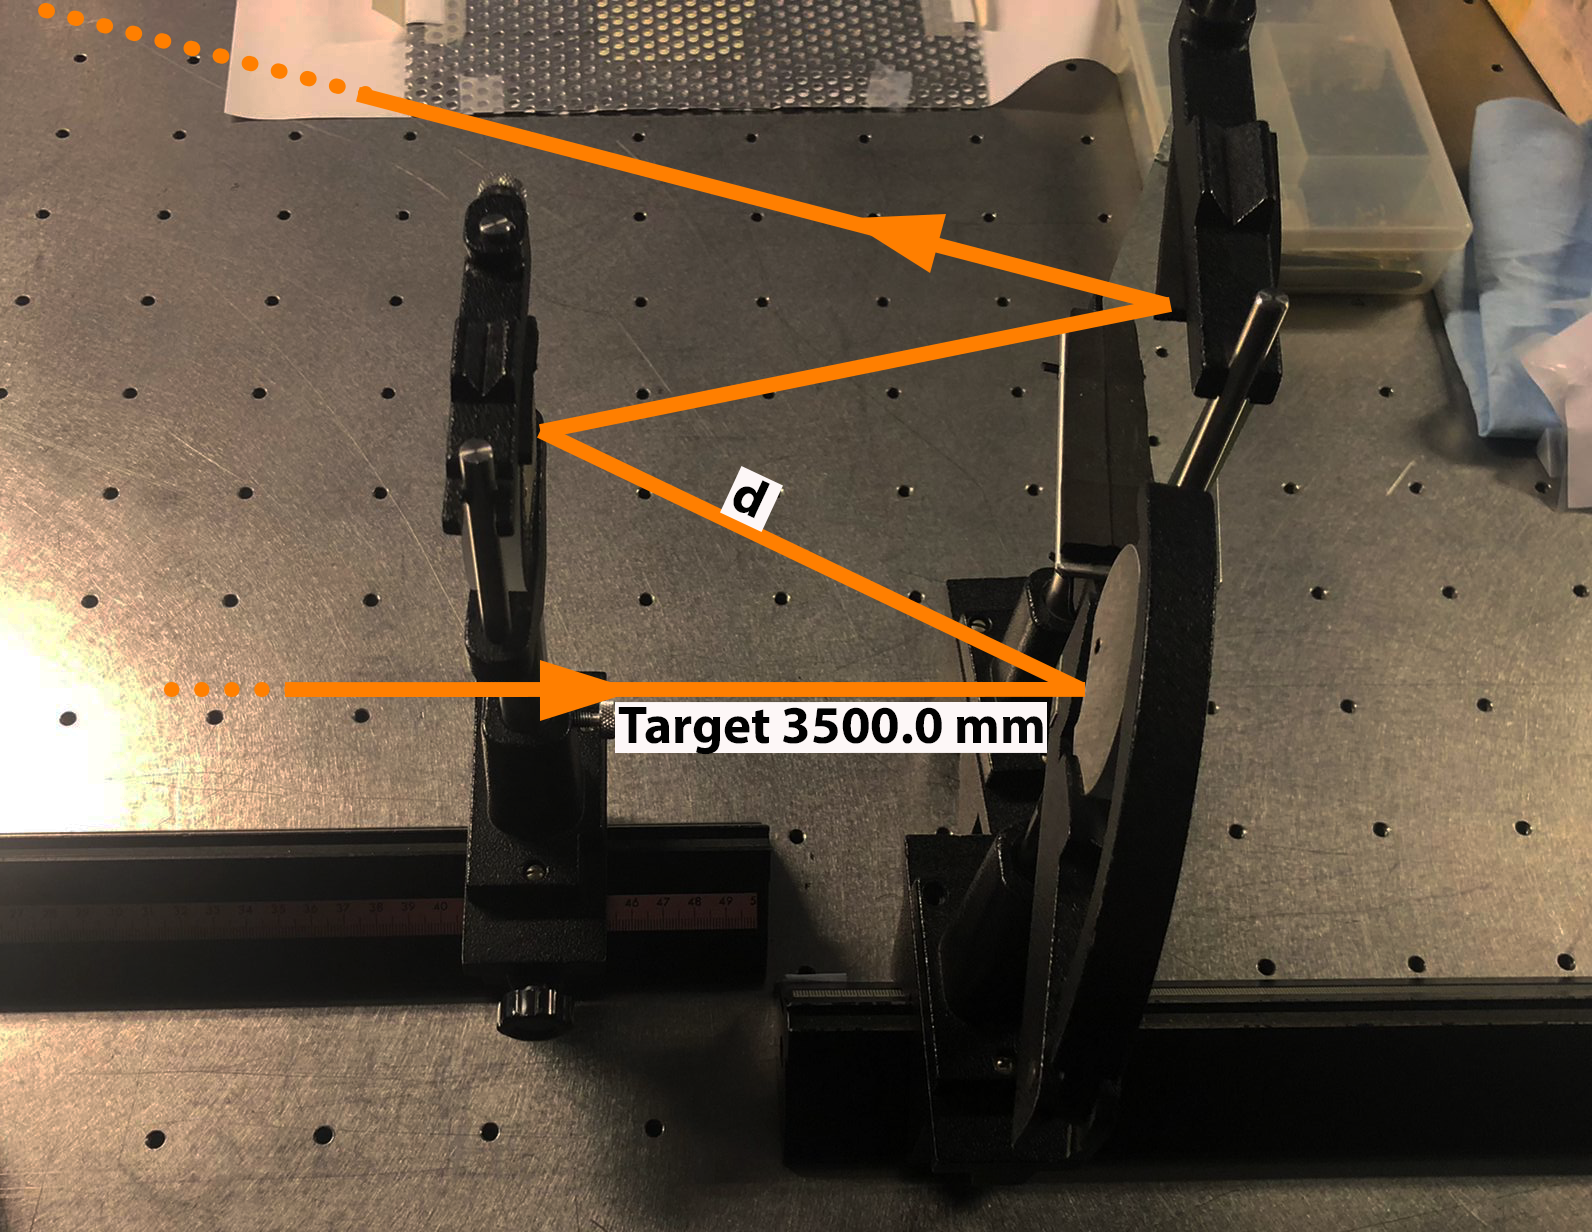
two spherical mirrors wiht a focal lenght of -200 mm and diameter of 50 mm
the target is a checkboard composed by 8 A3 pappers (840x1200)
the target is a 3500 mm from the first mirror
two tests was carried out:
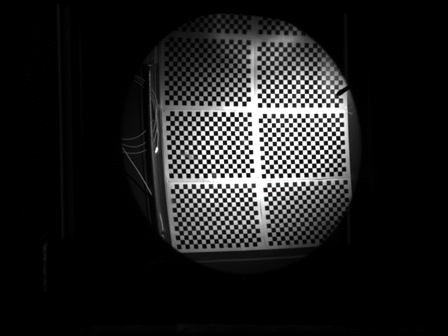
mirrors at 130 mm apart (d=130mm)
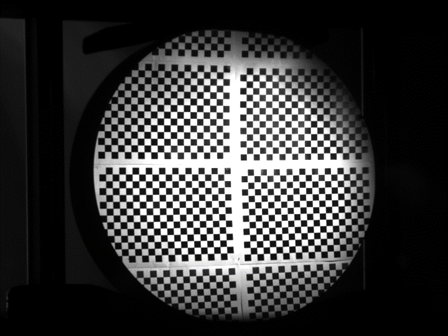
mirrors at 200 mm apart (d=200mm)
below the image of the set-up. Using this set-up I have obtained the images reported in Fig.2 and Fig.3
I tried to reproduce the set-up using Zemax (file attached). To simplify the simulation I have removed the flat mirror. With Zemax I can't get a result similar to the experimental one.
I think that my problem is in the aperture settings (system explorer > aperture). I have imposed Enter pupil diameter at 40 mm and the first mirror is the stop surface. However when I simulate the view with Image simulation tool I see only a dark rectangle. I obtain an image only if I reduce the diameter to 22mm but the immage is much worse than the experimental result. Also in the spot diagram I obtain RMS radius values huge.
Thanks for your help
Fig.1 - Set upFig.2 - Result d=130mmFig.3 - Result d=200mm
Best answer by Alissa Wilczynski
Hi Brando,
I didn’t 100% solve your problem, but I can share a few pointers.
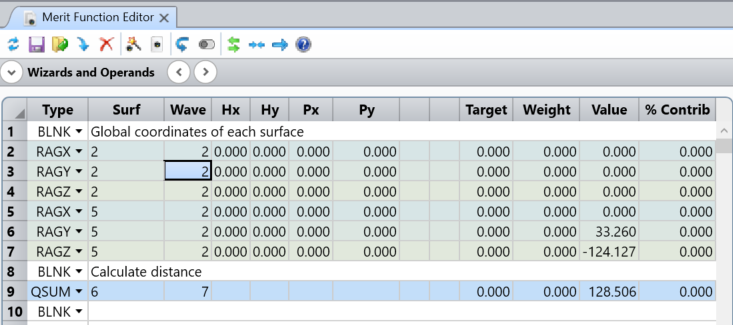
I don’t think the mirrors were perfectly positioned to be the 130 units apart as intended. I used RAGX, RAGY, RAGZ in the merit function editor to get the chief ray coordinates on each mirror surface, then used QSUM to calculate the total distance. This could account for a difference in measured behavior. FYI you can use the Merit Function not only to calculate things like below, but you could also set the thickness of a surface as a variable, give the QSUM operand below a target and weight, and optimize to get exactly the 130 and 200 unit distances desired. Distance between mirrors is Value of QSUM = 128.506
When you share a file for others to view, it’s best to send an Archive (.ZAR). With the .ZMX and .ZDA files you shared, I’m not certain that the settings on my Image Simulation analysis are the same as what you had. In fact, I’m pretty sure they’re not. And in this case, the settings for the Image Simulation analysis are very important.
I didn’t 100% solve your problem, but I can share a few pointers.
I don’t think the mirrors were perfectly positioned to be the 130 units apart as intended. I used RAGX, RAGY, RAGZ in the merit function editor to get the chief ray coordinates on each mirror surface, then used QSUM to calculate the total distance. This could account for a difference in measured behavior. FYI you can use the Merit Function not only to calculate things like below, but you could also set the thickness of a surface as a variable, give the QSUM operand below a target and weight, and optimize to get exactly the 130 and 200 unit distances desired. Distance between mirrors is Value of QSUM = 128.506
When you share a file for others to view, it’s best to send an Archive (.ZAR). With the .ZMX and .ZDA files you shared, I’m not certain that the settings on my Image Simulation analysis are the same as what you had. In fact, I’m pretty sure they’re not. And in this case, the settings for the Image Simulation analysis are very important.