Solved

bug in POP text export

  • January 16, 2023
  • 2 replies
  • 99 views

Hi all, 

I have a question regarding the POP analysis. After calculating the POP in Zemax sequential mode, I save the POP result as a *.txt file where you have all informations. Aftwards I read the *.txt file via Python and do further analysis and plots.

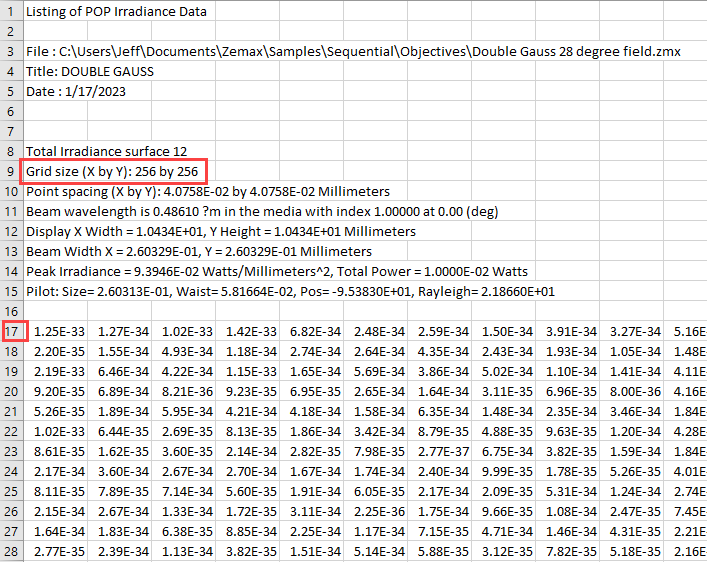
In the header you see in line 9: Grid size (X by Y): 256 by 256 

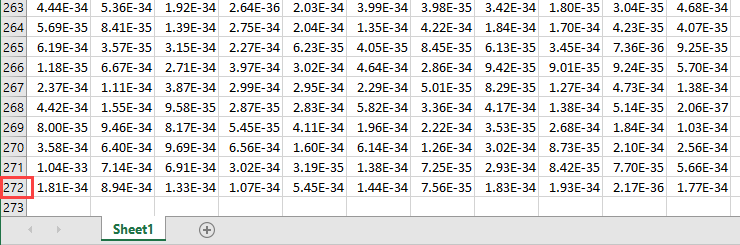
But when I read the data grid beginning in line 17, I get a grid of [255 x 256]

Is the data grid incomplete in height by one row?


greeting, Johann

Best answer by Jeff.Wilde

Hi Johann,

When I extract the POP data from the .txt file, I get a matrix with the proper size (e.g., 256 x 256).  Here’s what it looks like in Excel:


The total number of rows is 272 - 17 + 1 = 256 (i.e., rows 17 to 272, inclusive).

Regards,

Jeff


2 replies

Jeff.Wilde
Luminary
Forum|alt.badge.img+3
  • Luminary
  • Answer
  • January 17, 2023

Hi Johann,

When I extract the POP data from the .txt file, I get a matrix with the proper size (e.g., 256 x 256).  Here’s what it looks like in Excel:


The total number of rows is 272 - 17 + 1 = 256 (i.e., rows 17 to 272, inclusive).

Regards,

Jeff


  • Author
  • Infrared
  • January 23, 2023

Ok I see, reading this table via pandas needs a lot of argumends such as names to set the column names.