Solved

Batwing Model


How I can model a source with Batwing radiation pattern?
icon

Best answer by Thomas Magnac 15 April 2020, 10:53

View original

16 replies

Userlevel 4
Badge +2
Yes you can!

For example with a ''source radial'' in non-sequential mode:


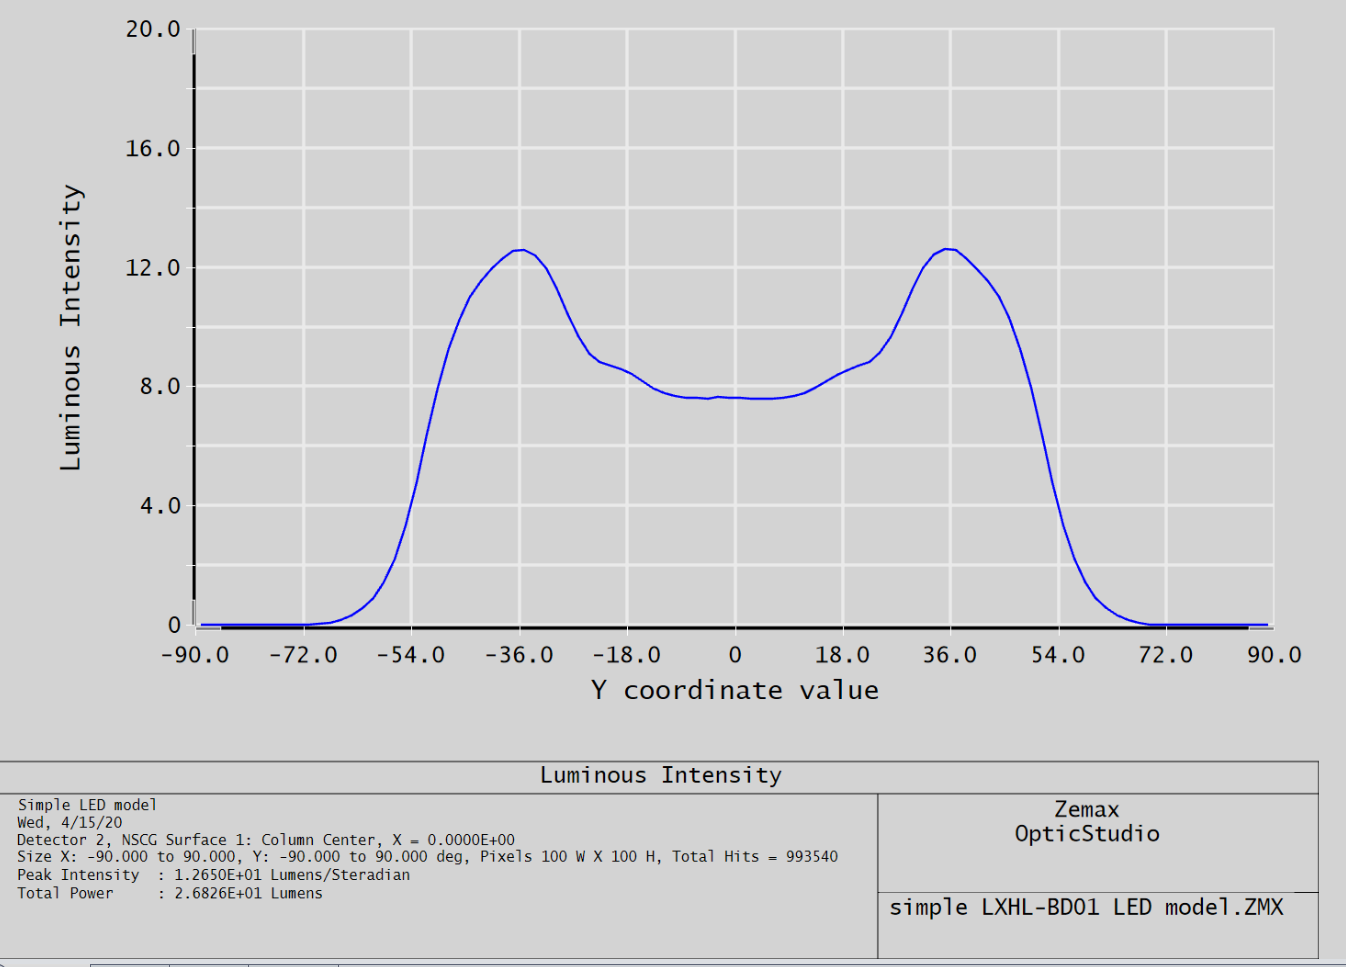
Check out the sample file:<data>\Samples\Non-sequential\Sources\simple LXHL-BD01 LED model.ZMX
Userlevel 3
Badge

I would like to make the equivalent of a 'Source Radial' in Sequential mode.


Any suggestions?


I have a multimode VCSEL with a 'doughnut mode' beam divergence profile to model in Sequential.


[Actually, it's not clear that the original poster Hossien was looking for an axisymmetric beam; he might be looking for a 2D Batwing like for a linear pendant luminaire.  But I'm looking for the Source Radial type pattern.]


Some ideas from either of these two Forum threads may be useful:


User-defined apodization


https://my.zemax.com/en-US/forum/threads/4fff8cce-d9ff-e911-b862-00155de91374


Super-Gaussian Beam Simulation


https://my.zemax.com/en-US/forums/GD-opticstudio/b316c56d-35c0-e911-b083-00155d46a44b#8f6ad625-1fc3-e911-a979-000d3a378ca2


Using the Extended Scene Analysis features (e.g. Geometric Bitmap Image Analysis) allows one to create a source in the OBJECT plane with a SPATIAL variation of irradiance, but not ANGULAR, which is what I really want.


I think the best way to start is to pick a System Aperture Type of Object Cone Angle or Object Numerical Aperture and set the Apodization Type to Uniform (Gaussian fall-off or Cosine cubed are the only other choices).  Then apply a transmittance function that varies with angle away from the axis using one of these ways (stolen from the 'Super-Gaussian Beam Simulation' thread in this Forum):


1. Make a User Defined Surface after the OBJECT and weight the rays that pass through it by a transmittance function [see 'User defined surface apodization using DLLs' in the User Manual].  If possible, calculate the transmittance function based e.g. on direction cosines to weight transmittance as a function of angle instead of ray position on the surface.


This requires me to learn C and write and implement a DLL (or can a DLL be written in Python and then compiled into C and made into a functional DLL?)...not the easiest.


2. Insert a Slide Surface with the desired transmittance function after the OBJECT.


This sounds easier, but I still need to learn how to generate a suitable image file. (BMP or JPG)


[Zemax supplies Slide Surface examples using image files in BMP and JPG formats, so we know those work. I guessed that PNG might also work (since it is also viewable by the same Bitmap File Viewer in OpticStudio), but it doesn't come up in the list of choices on opening a Slide Surface. Also not IMA, Binary IMA, or BIM as work in Geometric Image Analysis or Geometric Bitmap Image Analysis or Image Simulation.]


The trick here is that the Slide Surface is a planar surface, so that not only is the SCALE (size) of the transmittance pattern on the Slide Surface dependent on how far it is placed (thickness from) the OBJECT, but the transmittance pattern is also mapped NONLINEARLY from angle (by the sines and cosines) to radial position.  I.e., the Slide distance from the OBJECT needs to be decided first, and then proper scale and cosine mapping needs to be applied to make the transmittance function have the correct x,y positions of the pixels.


It would be nice if Slide Surface were not limited to Radius = INFINITY, but could be applied if not to a Standard surface, then at least to a sphere, whose radius should be chosen to equal thickness from the OBJECT, like the Detector Polar object in Non-Sequential Components.


Any better ideas?


-- Greg


Userlevel 4
Badge +2

Hi Greg,


How about a coating [angle dependant transmission] to model the apodization you want?


Any reason you want to do that in Sequential Mode ?


If yes, I would go for the custom apodization.


Best,

Userlevel 3
Badge

Thanks, Thomas!


I hadn't thought of a coating.  I'll look into what it takes to define such a coating, and how hard it will be to achieve the desired angular resolution.


Why Sequential?  A client of mine with Zemax is asking for multiple ways to approach their problem, and I think Sequential is much faster for optimization and tolerancing.  I already have experience with using a Source Radial for modeling a multimode VCSEL for another client.  (I just have to remember how I got the angular beam profile from a goniometer from an Excel column into 181 horizontal cells in the NSC Editor...cut and paste?)


BTW, neither of us thinks that POP is the best approach for this multimode (but unknown and inconsistent) input having M^2 around 3 to 5.


-- Greg

Userlevel 4
Badge +2

You're much welcome!


You're right about the efficiency of sequential.

Yes, you can transform a column into a line in excel, and copy paste it [check out the express editor view].


Best,

Userlevel 3
Badge

Thomas,


EXCELlent!:-)


Thanks again.  I think that I did use TRANSPOSE in Excel to turn a column into a row of values, and then just cut and paste.


I also appreciate your mention of Express Editor, which I have not used, and I believe is a new feature since I did that originally.


Another way might be to save the values in a .TXT file, and then could a ZPL Macro using the SETNSCPARAMETER keyword be used to populate the proper cells in NSC Editor?  Need to figure out the correct surface number and parameter column numbers (always a bit tricky since they are not labeled with numbers in NSC Editor).  Are there any ZPL examples that use the SETNSCPARAMETER keyword for reference?


I see that I last did that in Feb. 2016...no wonder it's hard to remember.


And if you can, consider this feature request from 2016:


*** I still say that a built-in unified interface for reading in lists of parameters like this in x, y format from a TXT file would be great for many of these user-defined NSC objects such as Freeform Z and the Tabulated objects that can take in a .TOB file.  I think I have made that request before 2016...


I realize that in this current case I will need to make sure that my angular increments are correct to be evenly-sampled, due to the limitations of Source Radial, but really, Source Radial should be able to spline-fit unevenly spaced points like Freeform Z.


-- Greg

Userlevel 4
Badge +2

Greg,


;) Yes, you can use ZPL, however, I believe copy/paste will be easier to do.


You could indeed do a macro reading a .txt line by line, and writing in the parameter using a loop with:


<


SETNSCPARAMETER surface, object, parameter, value


>

What about this:


You can save your rays from non-sequential mode as a .sdf file, and then use this as a source in sequential mode.


Although there is no operand to optimize on that [and it would probably be slow], but you can use it to check the results after optimization.


Best,

Userlevel 3
Badge

Thank you again, Thomas, for confirming possible use of ZPL, and for another interesting idea.


I am not familiar with Light Source Analysis, but it's good to know about it.


Unfortunately, I see that it is only available in the Premium edition, and I have Professional.  That is one reason I wasn't aware of it!  I should have mentioned that I am using Professional in my post.


Actually, maybe it would be good to have some way to 'check a box' in Forum posts as well as KnowledgeBase articles so that we could filter out methods that are only available in certain editions e.g. Premium.  I think I'll suggest that to webmaster Nick.*


-- Greg


*I have already sent Nick a suggestion (place dates on KnowledgeBase articles!!) and a bug report (my reply to you above was time-stamped 4 hours BEFORE your previous post!), and he has replied.

First of all, thanks to you, Thomas, for your help and support. However, the source that i want to model has a non-uniform intensity at the two side so source radial cant be used. Please let me know the other option to model it.


For your information, we have measured the oprical power for the range of -90 to 90 degree in vertical plane while in horizntal we just consider 0 degree.


Thanks. Hossien

Userlevel 4
Badge +2

Hi again Hossien, thank you very much!


And thanks for taking our online training too!


If you are happy with the source radial, but have non-uniform intensity at the two side lobes, I would recomment to simply do a multi-configuration, one for the right lobe, and one for the left lobe.


Best,

Hello again, and yes I enjoy your online training.


Thanks for your suggestion. I would like to know if there are other options.


All the best 

Hey again,


For example, is it possible to edit these data in source directivity plot of OpticStudio? I need same format to be equivelevt to my measured data.


Thanks and best regards


Hossien

Userlevel 4
Badge +2

I would use 2 config with the source radial.


You could also use a source DLL, although it requires coding, or a source file.


Userlevel 3
Badge

Hi, Hossien and Thomas.


Hossien, I'm assuming you want to stick with Non-Sequential mode for your Source work.


Here's an idea to tailor your source to be asymmetrical:


Use multiple Source Radials having different radial angular patterns, place them at *almost* the same X,Y,Z source position and angle (pointing along the same axis), but stagger them by tiny axial amounts (microns!) interspersed with absorbing surfaces positioned and sized/shaped to block their radiation in the directions you don't want them radiating.  I haven't tried this to see how difficult it is, but think about making a 'compound source' out of multiple sources all 'running' at once.  You can model a complicated source by using more than one source at the same time!


-- Greg


================


BTW, if you're interested in Sequential methods that we discussed in an earlier exchange within this same thread, I did ultimately have success using more than one method:


TABLE COATING, which tabulates transmission (and phase, which I didn't use) of the coating on a surface for a table of an unlimited number of incidence angles


US_FILT7 (a User-Defined Surface Apodization, supplied by Zemax in the  /DLL/Surfaces folder), which can do apodization either by radial position on the surface, or the angle (which I used), but limited to 100 angles.  Although US_FILT7 is limited to 100 points as written, the C source code is provided to start from.


KA-01488: Using the similar technique to US_FILT7 (a User-Defined Surface DLL) discussed in KnowledgeBase article KA-01488 'How to read a static data file into a user-defined surface' by Sanjay Ganghadara. This may be more convenient than US_FILT7, since it allows reading in tabular data from a file instead of having to enter all the values into the Lens Data Editor (although that is not too difficult using cut and paste from e.g. a spreadsheet).  I used the second version of the DLL discussed in KA-01488 (US_FILT_FILE2) and had to learn when OpticStudio updates reading the DLL.  This apodization is by radial position only, not angle.  But I found that for the incidence angle ranges of my problem, the difference between position and angle was neglible.  I believe that US_FILT_FILE2 is also limited to 100 maximum entries for radial position coordinates (from center to outer Semi-Diameter edge of surface) because MAX_TEXT_PARS = 200 x,y pairs.  If you can edit and compile DLLs, you could alter this, too.

Userlevel 3
Badge

Also, Hossien, is your Source1.txt example above actual measured data, or just an example for your question?  If it's real data, it's awfully symmetrical already, and pretty Gaussian, too!


Hello Dear Greg,


Many thanks for your detailed explanations which I will try all of them not only because of my quetion but also to gain experience about them.


Acoording to my case, our data is real measurements and they are not symetrical. I will try using two radial source which i see it easier for now. However, if there is an option to edit in IES file directly in OpticStudio, it will much help us in our future measurements.


Thanks again for you and Thomas as well. - Hossien


Reply