Hi Katrin and all,
This is a very intriguing problem. I do not have a completed answer, but I have some emerging ideas I would like to share, so if my thinking is flawed it can be corrected by those who no more about this. (Sandrine?)
Rather than writing a DLL for this, it might be easier to construct a Zemax Beam Definition File (ZBF) that produces the desired wavefront. A previous discussion of this can be found here. The ZBF file contains electric field components for each pixel in the beam cross section. From the desired angular distribution the ZBF entries could be calculated by computation, I would use Mathematica -- Matlab or Python would do as well.
Another alternative would be to use OpticStudio Non-Sequential mode to produce the needed values from the intensity and phase values for the pixels of a detector. These values could be used to calculate the real and imaginary components of the field. The detector pixel values are available as exports from the text window of the detector. Two windows are needed, one for intensity and another for phase. (Some parsing is needed since they are in a human readable format -- a CSV export of just the values would be nice to have.)
Some care is needed in the layout of the source and detector because if a divergent beam propagates too far it produces a waveplate with so many zones that the phase is difficult to resolve with practical sampling windows.
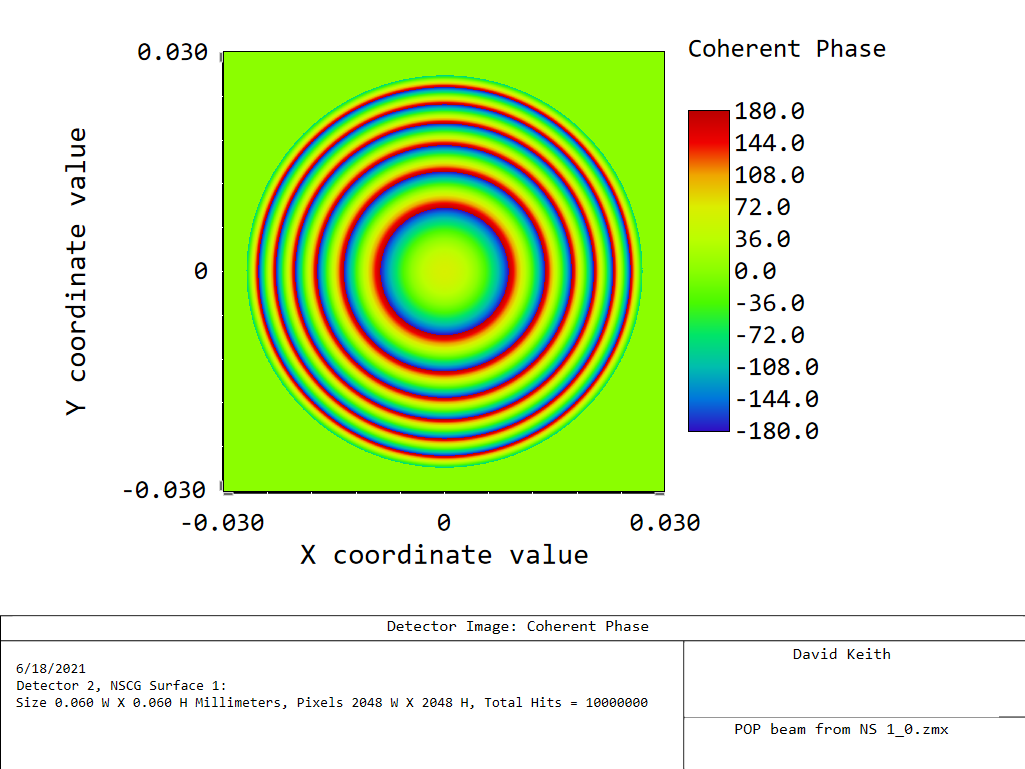
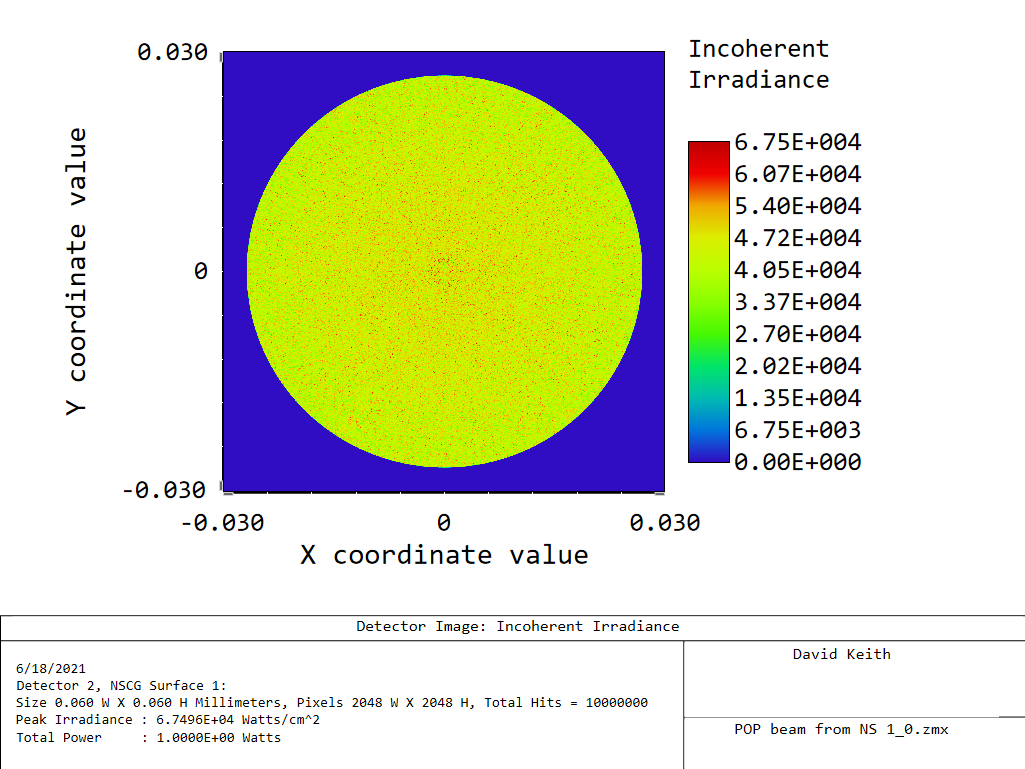
Here is an example of this idea. A 15 degree half angle point source is traced to a 2048x2048 detector at 0.1 mm distance. The detector window is 60um x 60um.
The phase readout on the detector displays the expected spherical wavefront. The phase is sampled without aliasing:
The intensity readout:
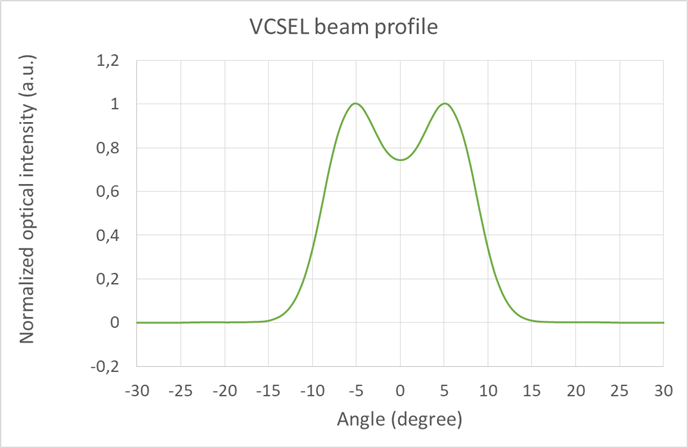
This is for a cone shaped angular distribution. For other distributions, other sources could be used. The batwing distribution could be modeled using the Source Radial object. Extended sources could also be represented, with coherent detection as necessary
I'm very interested to hear what others think of this.
Kind regards,
David