Solved

Analysis of a footprint diagram in sequential mode

  • 12 January 2023
  • 4 replies
  • 344 views

Hi dear community,

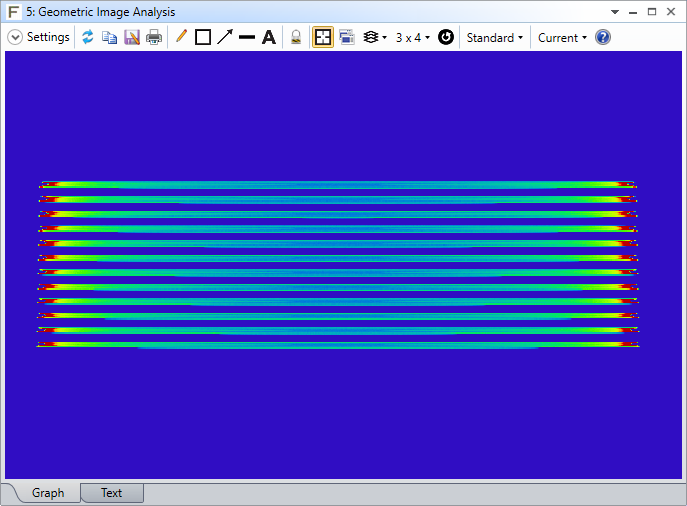
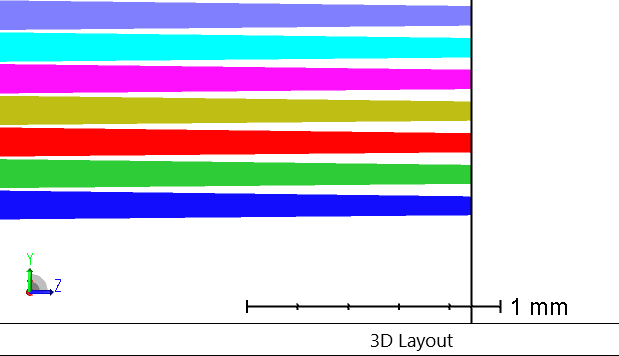
my question is about analysing the data resulting from a footprint diagram with different configurations and wavelengths. I have created an optical setup in sequential mode that includes a diffraction grating in order to separate wavelengths in the C-band. I use an “Object Space NA” aperture with a VCX vignetting factor to describe my input source, and the 24 separated wavelengths from two configurations are shown using the footprint diagram.

(a) Model of the setup, diffraction grating in purple, surface to observe wavelengths in green. (b) Footprint diagram of 2 configuration with 24 wavelengths

I would like to use the data provided by the diagram in order to evaluate the crosstalk of the wavelengths, while performing a tolerance study of the setup by varying parameters at the Lens Data Editor.

I understand that there are some limitations following this approach with ray tracing. Is it possible to exploit the diagram in such way to measure the crosstalk of the wavelengths? Or do I have to use a different approach with a different source to solve my problem, for example using illumination and a detector in non-sequential mode? (I haven’t studied NSC so much yet). I also attach my file here.

Any help is much appreciated and thank you very much in advance.


Kind regards,

George

icon

Best answer by Jeff.Wilde 13 January 2023, 23:42

View original

4 replies

Userlevel 7
Badge +3

Hi George,

Looking at your model, pure ray tracing seems to indicate the wavelengths are fully separated on the surface labeled “PANEL” with no crosstalk:


You may want to consider using Physical Optics Propagation, in which case your source can be defined as a mode (e.g., a Gaussian beam or an imported waveguide mode) for a given wavelength, and diffraction during propagation is taken into account.  You could then look at the fields for two adjacent wavelengths at whatever surface you like and see if crosstalk exists (based on spatial overlap). 

Regards,

Jeff

Hi Jeff,

thanks for your reply. I have already done numerous attempts with POP but there were many errors that prevented me from observing the panel as I do with ray traycing. Also, using this approach with raytracing it is  possible to combine different wavelengths from different configurations in a single diagram, but in POP I think there are restrictions in that.

I believe that what I am looking for is similar to “Show: Cross Y” plot that is offered by Geometric Image Analysis. In this way I could quantify the crosstalk between the channels in a tolerance study. However, my diagramm cannot be plotted in such way to show the Cross Y.

Is there a way to convert a footprint diagram (or any other spot diagram) to a file type where I can plot the Cross Y?

Many thanks again in advance.


Best,

George

+question


Is it possible to save a spot diagram as a .dat format?


Thank you,

George

Userlevel 7
Badge +3

I don’t think you can use either the footprint diagram or the spot diagram to obtain 2D data sets.  For ray tracing, your best bet is to use the Geometric Image Analysis tool:


You can then obtain the 2D data via: (a) cut-and-paste from the text window, (b) the ZPL using the GETTEXTFILE keyword (you’ll need to parse the text file to extract the data), or (c) the ZOS-API which should give you direct access to the data.  Once you have the 2D irradiance data, you can look at one column for a cross section, or sum a few columns together for better SNR.  

Alternatively, you can use ZOS-API to conduct a batch raytrace and then analyze the results.  You should also be able to perturb the system within the API per your tolerance stack, and repeat to look for changes in crosstalk.

Again, with ray tracing, as you probably know, you are neglecting diffraction effects.  However, if you are confident that diffraction is negligible for your system, then ray tracing should be okay assuming you are modeling your source properly.

Regards,

Jeff

Reply